Dogecoin Price Prediction: DOGE targets $0.19
- Dogecoin price rallied towards the 200-day SMA on Tuesday.
- DOGE price sees a partial paring back of gains and is searching for support.
- Expect another uptick towards $0.19, once profit-taking is over, and the RSI has cooled down.

Dogecoin (DOGE) saw the sell-side dry up as bulls charged and drove DOGE price to the upside towards $0.18, booking roughly 21% in the process. But the fierce rally underwent heavy profit-taking this morning as the Relative Strength Index (RSI) moved sharply into the ‘overbought’ area with Tuesday’s move and saw bulls quickly taking profit on that signal. With the fade currently happening, it will be essential to see if the double support belt can withstand any further selling and push the price back south to break above $0.18 and the 200-day Simple Moving Average (SMA).
Can the double belt withstand profit-taking in DOGE price, yes or no
Dogecoin price saw bulls making a tremendous effort, squeezing bears that had been sitting on their short positions since $0.16 and the beginning of February. With stops being run, this resulted in DOGE price action piercing through $0.16 and rallying another 2 cents towards $0.18 before closing below the monthly R2 resistance level. That close below triggered profit-taking this morning as, together with that close, the RSI alerted bulls that DOGE price was trading in ‘overbought’, and therefore not offering more room to the upside for now.
DOGE price is now undergoing some paring back of the gains and is looking for support. That support should come from $0.16, where a fundamental historic pivotal level is present, and the monthly R1 is just a few cents below. With this double belt of support, DOGE bulls should be able to defend and balance Dogecoin price by refraining from making further lows and keeping sentiment in check for a swing back south towards $0.19.
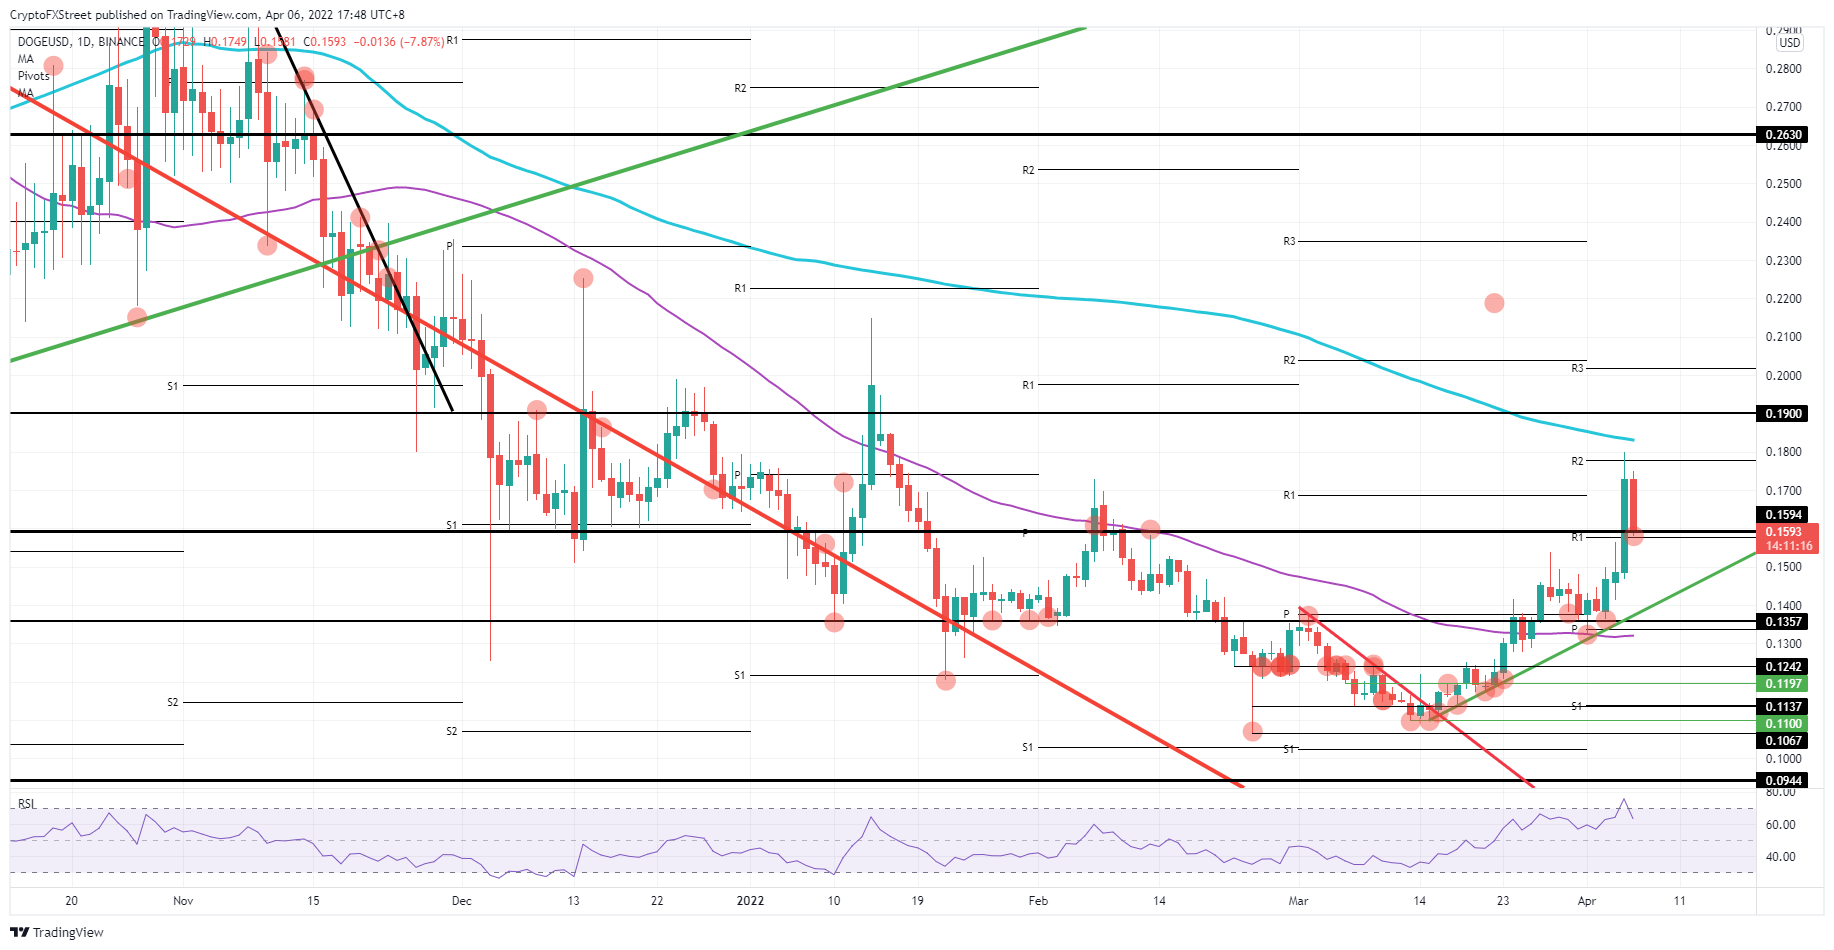
DOGE/USD daily chart
With support nearby, any upswing could be short-lived as the RSI will quickly be trading back into the ‘overbought’ area. Expect bears to be looking at this and using this technical alert as an excuse to push bulls against the green ascending trend line near $0.14. Although this level holds several supportive elements, a break below could see a total drop back towards $0.12, resulting in a 25% loss.
Author

Filip Lagaart
FXStreet
Filip Lagaart is a former sales/trader with over 15 years of financial markets expertise under its belt.


