- Dogecoin price has dipped under support at $0.055, opening up the possibility of a steeper correction.
- Transactional data shows investors who purchased 20.70 billion DOGE from $0.050 to $0.055 are underwater.
- A breakdown of the critical support barrier extending $0.048 and $0.043 will lead to a 10%-to-45% correction.
Dogecoin price shows a failure to hold above the bull flag’s breakout point at $0.055. This lack of buying pressure has caused a pullback into the consolidation zone. Now, DOGE faces a bearish outlook that could result in a steep correction.
Dogecoin price fakeout leaves a lot of investors underwater
Dogecoin price surged nearly 300% in less than ten days from January 30 to February 7. After which, DOGE consolidated, forming a series of lower highs and lower lows. The meme coin’s price action from January 30 to February 24 is known as a bull-flag pattern.
This technical formation is a continuation pattern and forecasts a 75% upswing, which is the flag pole’s height added to the breakout point at $0.055.
On February 24, Dogecoin price signalled a bullish breakout from this setup after a 12-hour candlestick closed above $0.055. However, the volume didn’t align with the breakout. The sellers seized the opportunity and strong-armed DOGE back into the consolidation, which has resulted in a flipped bullish scenario on its head.
Adding credence to this bearish outlook is the price dip below the short and mid-length exponential moving average (EMA), ranging from $0.041 to $0.043.
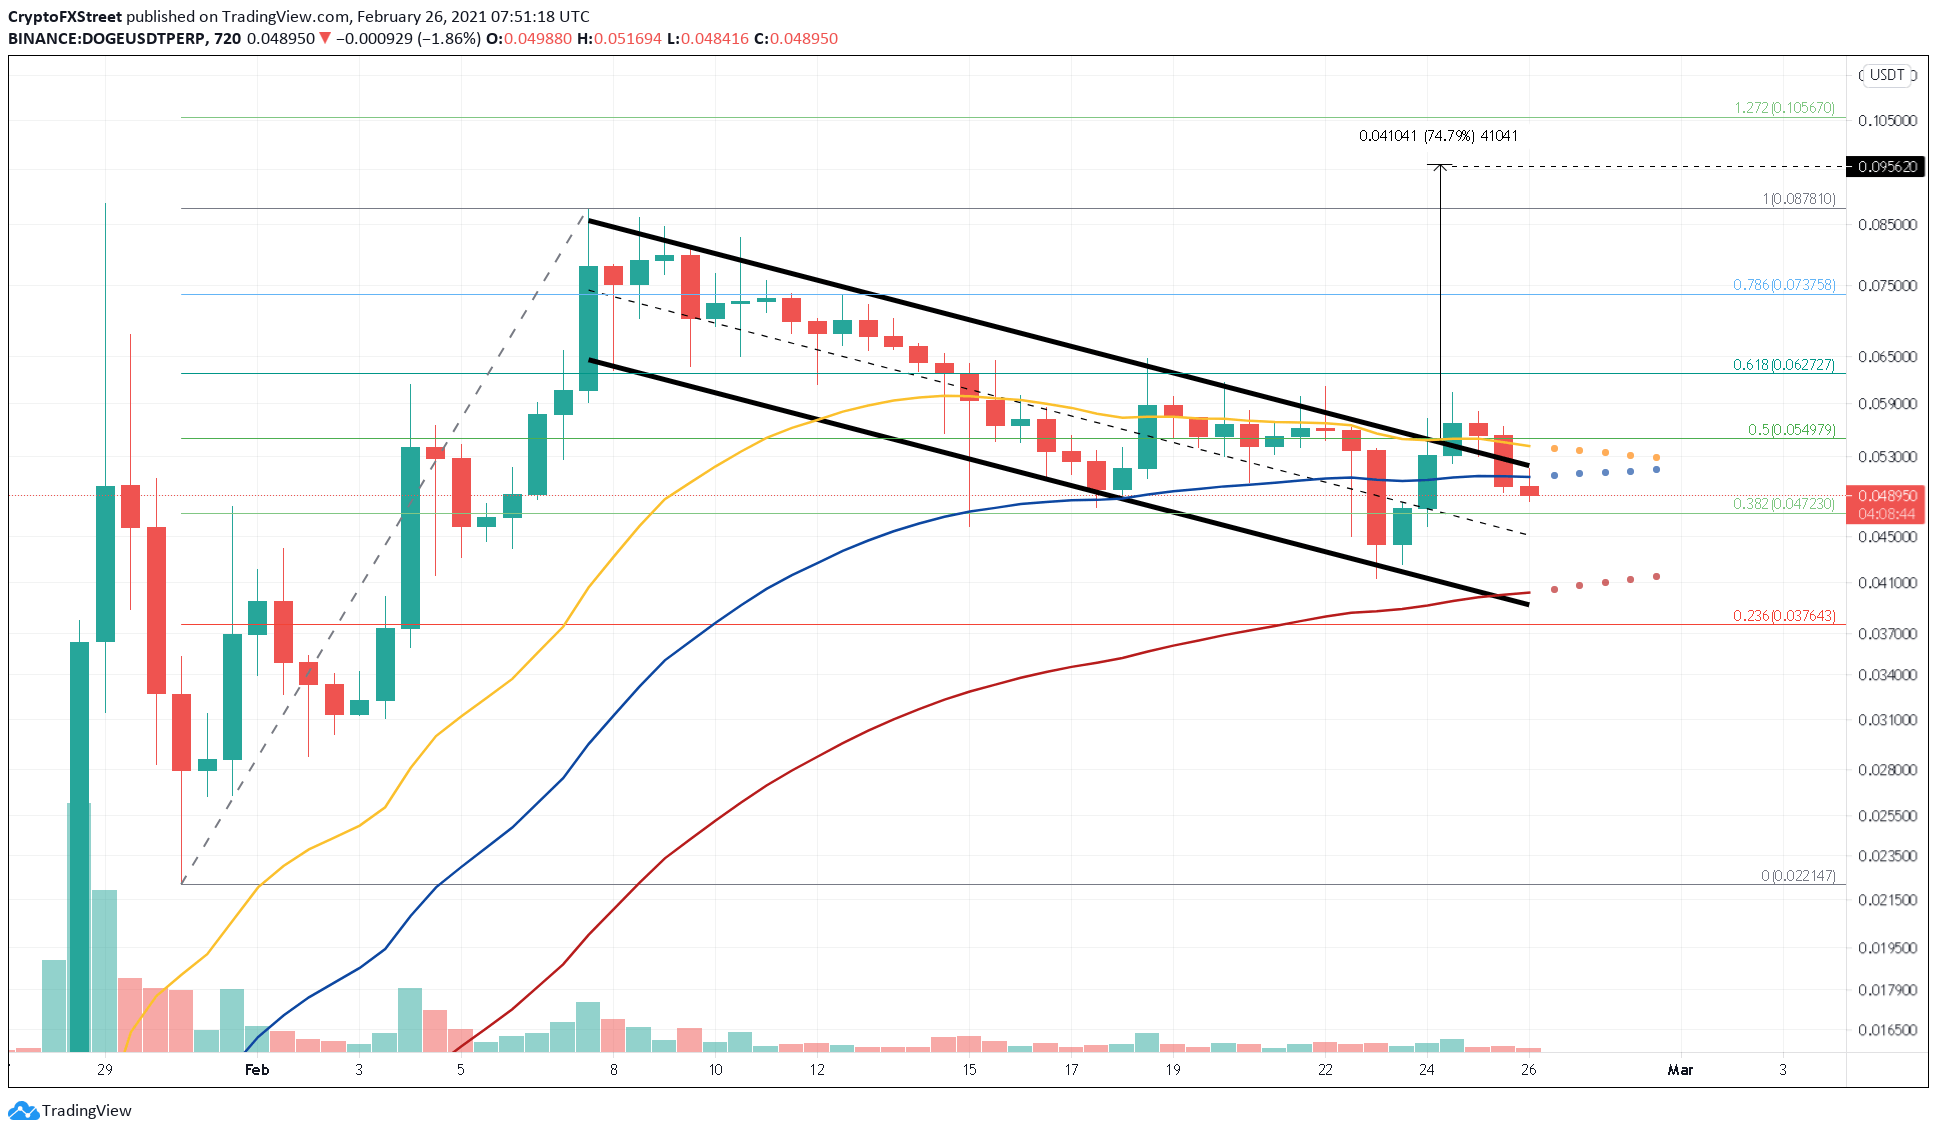
DOGE/USDT 12-hour chat
IntotheBlock’s In/Out of the Money Around Price (IOMAP) model shows that nearly 86,500 addresses purchased a whopping 20.70 billion DOGE between $0.050 to $0.055. Due to the fakeout, these investors are “Out of the Money.” So, any bullish momentum will be absorbed by these market participants who want to break even.
IOMAP cohorts show relatively feeble support at $0.0481, where nearly 41,000 addresses purchased roughly 944 million DOGE. If Dogecoin price manages to slice through this demand barrier, a 20% pullback to 23.6% Fibonacci retracement level at $0.037 seems likely.
However, a sudden spike in selling pressure due to unforeseen events causing a 12-hour Dogecoin price candlestick close below $0.037 will spell trouble for the meme coin and result in a 40% crash to $0.022.
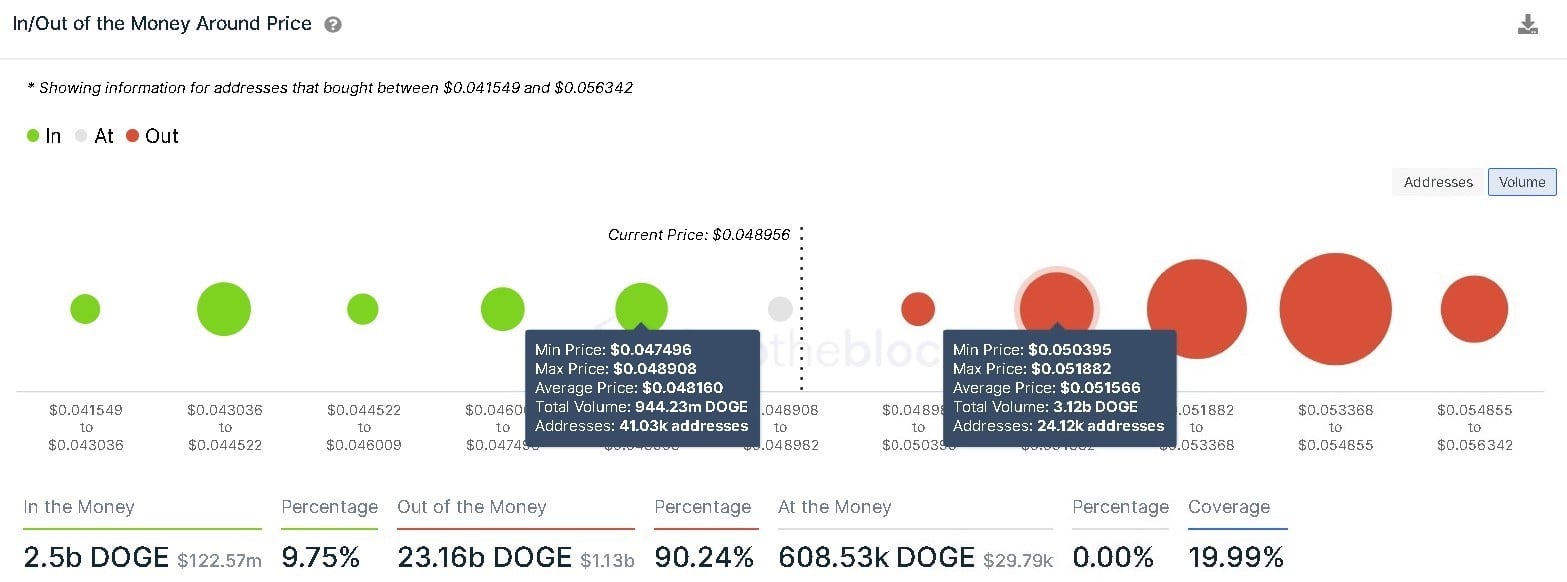
Dogecoin IOMAP chart
It is worth noting that a 12-hour candlestick close above the 50% Fibonacci retracement level at $0.055 would reignite the 75% upswing from a bull flag pattern to $0.0956
Information on these pages contains forward-looking statements that involve risks and uncertainties. Markets and instruments profiled on this page are for informational purposes only and should not in any way come across as a recommendation to buy or sell in these assets. You should do your own thorough research before making any investment decisions. FXStreet does not in any way guarantee that this information is free from mistakes, errors, or material misstatements. It also does not guarantee that this information is of a timely nature. Investing in Open Markets involves a great deal of risk, including the loss of all or a portion of your investment, as well as emotional distress. All risks, losses and costs associated with investing, including total loss of principal, are your responsibility. The views and opinions expressed in this article are those of the authors and do not necessarily reflect the official policy or position of FXStreet nor its advertisers. The author will not be held responsible for information that is found at the end of links posted on this page.
If not otherwise explicitly mentioned in the body of the article, at the time of writing, the author has no position in any stock mentioned in this article and no business relationship with any company mentioned. The author has not received compensation for writing this article, other than from FXStreet.
FXStreet and the author do not provide personalized recommendations. The author makes no representations as to the accuracy, completeness, or suitability of this information. FXStreet and the author will not be liable for any errors, omissions or any losses, injuries or damages arising from this information and its display or use. Errors and omissions excepted.
The author and FXStreet are not registered investment advisors and nothing in this article is intended to be investment advice.
Recommended Content
Editors’ Picks
Bitcoin, Ethereum prices struggle after mixed US NFP data

BTC and ETH prices experienced a temporary pullback as crypto market participants reacted to the news of the US NFP data release for May. Similar to the situation in April, the number of Nonfarm Payrolls added far exceeded the market’s expectations.
Solana: A break above $26.30 would spell doom for bears

SOL price has been trading with a bullish bias after an explosive breakout on December 30. However, because of volatility and the gloom in the broader crypto market, SOL has been unable to break above a key hurdle at $26.30, causing the price to trade sideways.
Bitcoin Weekly Forecast: BTC targets $30,000 as short-term bias turns bullish

Bitcoin (BTC) price shows a clear sign of the bulls’ victory. After failing to trigger a steep correction, bears look now out of context, at least in the short term, allowing buyers to restart a minor uptrend.
China crypto community picks Ethereum, Arbitrum and BNB Chain as top protocols

Ethereum, Arbitrum and BNB Chain protocols are top picks for the Chinese crypto community, data from a report shows, a possible bullish catalyst for tokens related to these protocols as Hong Kong opens the door of crypto to retail investors.
Bitcoin: BTC targets $30,000 as short-term bias turns bullish

Bitcoin (BTC) price shows a clear sign of the bulls’ victory. After failing to trigger a steep correction, bears look now out of context, at least in the short term, allowing buyers to restart a minor uptrend.