Dogecoin Price Prediction: Could DOGE turn deflationary after 100% rise? Elon Musk weighs in
Dogecoin price today: $0.3960
- Dogecoin's co-founder Billy Markus suggested a code change to make the token deflationary.
- Elon Musk, along with other crypto enthusiasts, replied that Dogecoin's flat inflation could be a feature and not a bug.
- Dogecoin could rise by another 100% if it follows Bitcoin's historical move, according to trader Peter Brandt.
Dogecoin (DOGE) is down 4% on Thursday after key figures, including Elon Musk, shared views on its token design and what a deflationary path could mean for its appeal as a currency. Meanwhile, traders Ali Martinez and Peter Brandt highlighted key similarities between Dogecoin's current price movement and historical data.
Elon Musk suggests Dogecoin’s flat inflation is not a bug
Dogecoin has been the best performer among top cryptocurrencies, soaring over 100% following several bullish triggers in the past week.
President-elect Donald Trump's recent declaration of the Department of Government Efficiency (DOGE) on Tuesday and appointment of Elon Musk as a co-lead for the project stirred further gains for the meme coin earlier in the week.
However, despite Dogecoin's rally, investors are expressing concerns about its unlimited supply, which could cause inflationary pressure over time. Unlike cryptocurrencies like Bitcoin, which has a supply cap of 21 million BTC, Dogecoin's supply will remain in a constant uptrend.
Dogecoin co-founder Billy Markus suggested a code change to the meme coin's protocol would solve its inflationary design. He highlighted some lines of code that anyone can use to change the inflationary structure and create a new version. Dogecoin's community and miners must come to a consensus to use the new version before such changes can be effected across the network.
However, Tesla and SpaceX CEO Elon Musk suggested that Dogecoin's flat inflation mechanism — only a fixed number of its tokens can be issued per time — is a feature. The token's flat inflation implies a decreasing percentage of inflation over time.
Markus concurred with Musk's suggestion, stating, "It is ideal for something intended as a currency [to have] steady, predictable inflation with a percentage that goes down much lower than the [US] Dollar."
Dogecoin Price Prediction: Can DOGE pull historical move?
DOGE trades near the $0.4000 psychological level after a mild correction in the Asian trading session. The correction sparked nearly $45 million in DOGE futures liquidations in the past 24 hours, per Coinglass data. Liquidated long and short positions accounted for $27.81 million and $17.02 million, respectively.
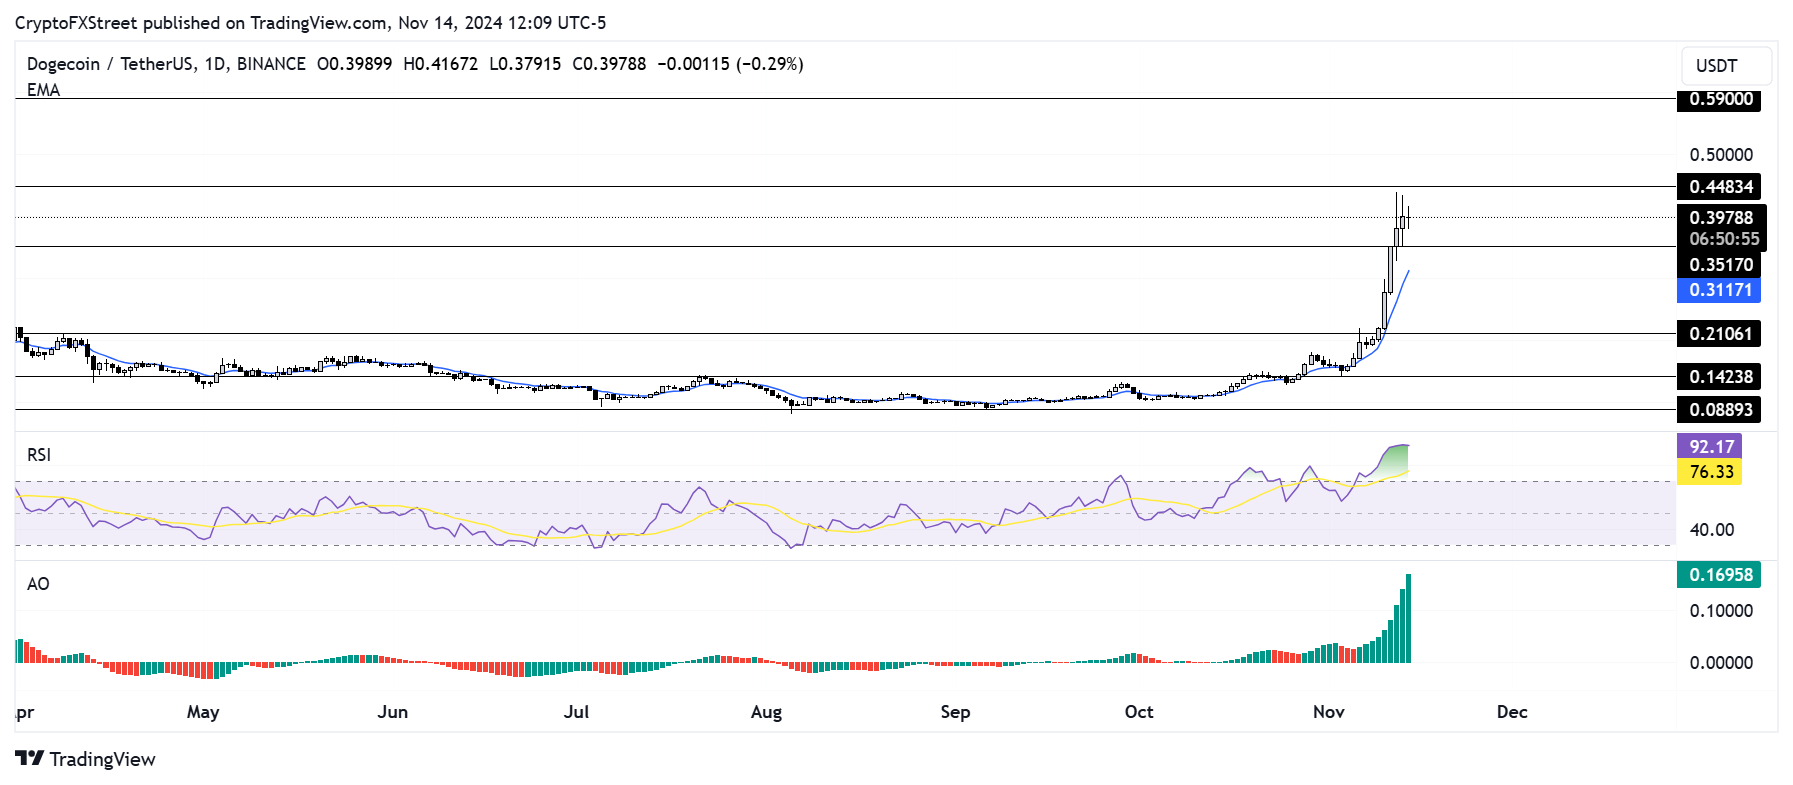
DOGE/USDT daily chart
DOGE is eyeing the $0.4483 resistance, a level last seen in May 2021. A firm close above this resistance will see DOGE rally toward the resistance near the $0.6000 psychological level.
The Relative Strength Index (RSI) is far inside its oversold region, indicating a potential pullback could be imminent.
In an X post on Wednesday, crypto analyst Ali Martinez hinted that DOGE may continue its bullish run but could see double-digit corrections along the way based on historical patterns.
In 2017, #Dogecoin surged 9,470%, with two major corrections along the way—one at 40% and another at 84%. In 2021, $DOGE rocketed 30,700%, again seeing two key pullbacks of 46% and 53%.
— Ali (@ali_charts) November 13, 2024
Now, as #DOGE seems to be entering another parabolic run, remember that corrections are part… pic.twitter.com/7bz7eosMMU
Trader Peter Brandt also provided a similar analysis to Ali, comparing DOGE's current price chart to Bitcoin's 2016 price movement. According to him, DOGE is "at a life cycle where BTC was in May 2016."
Does anybody see the similarities of $DOGE to the $BTC chart in 2015-2016?
— Peter Brandt (@PeterLBrandt) November 13, 2024
-Blow off top
-Correction via a falling wedge
-Double bottom
-Complex correction following completion of double bottom
DOGE is at life cycle where BTC was in May 2016
It was the chart in Spring 2016 that… https://t.co/bpJbFyrAyS pic.twitter.com/QiOhpEnaal
If DOGE follows the Bitcoin 2016 chart, it could rally over 100% in the next few months.
A daily candlestick close below $0.3517 will invalidate the bullish thesis.
Author

Michael Ebiekutan
FXStreet
With a deep passion for web3 technology, he's collaborated with industry-leading brands like Mara, ITAK, and FXStreet in delivering groundbreaking reports on web3's transformative potential across diverse sectors. In addition to


