Dogecoin price gains evaporate, putting a bullish DOGE outcome in doubt
- Dogecoin price still struggling to sustain a breakout above May’s descending trend line, despite today’s explosive gain.
- DOGE 200-day simple moving average (SMA) serving as a magnet for price but not conclusive on support or resistance.
- Daily Relative Strength Index (RSI) triggers an oversold condition for the second time since June 21, hinting at selling exhaustion.

Dogecoin price has been unable to overcome the determined resistance outlined by May’s descending trend line and today’s notable reversal of earlier gains suggests that DOGE will once again fail to close above the trend line. Until there is a definitive daily close above the trend line, the meme token will be stranded in a price range reinforced by the 200-day SMA and the head-and-shoulders neckline.
Dogecoin price strength is still being questioned without FOMO
At today’s high, Dogecoin price showed a 27% gain after triggering a double bottom pattern, marking the best day for the cryptocurrency since the May 8 high of $0.760. However, the DOGE gains have receded as the day has progressed, leaving a gain of just 12% at the time of writing and a successful close above May’s descending trend line in doubt. A clear indication that FOMO remains dormant.
The probabilities were stacked in favor of a better outcome for Dogecoin price today as the oversold reading on the daily RSI coincided with a bullish momentum divergence on the 12-hour chart and a potential double bottom pattern. Moreover, DOGE is propped up by credible support in the 200-day SMA. Still, the confluence of technical levels and indicators has not motivated the digital asset to sustain the gain of 27%.
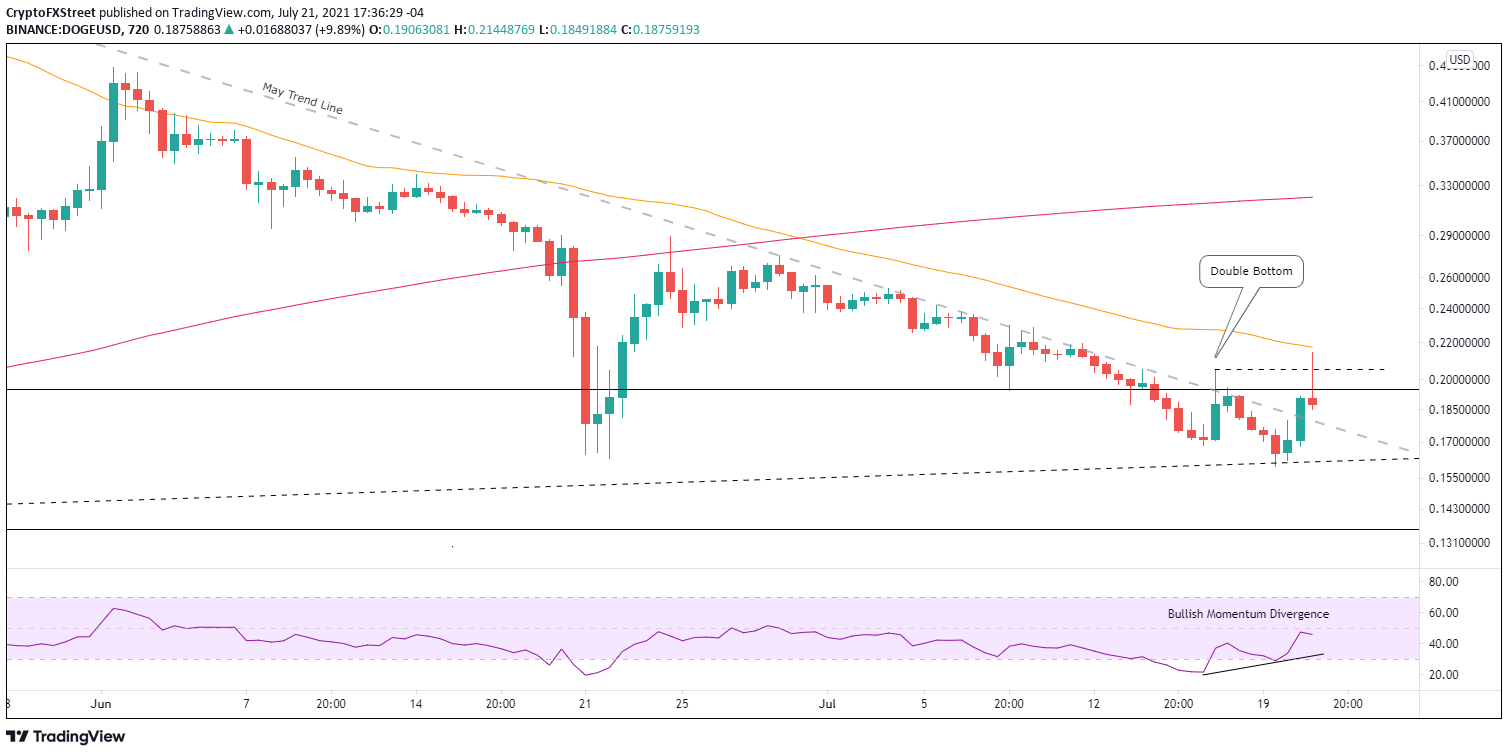
DOGE/USD 12-hour chart
Dogecoin price may recover a large portion of the gains achieved earlier in the day and finally close above May’s descending trend line. If that occurs, DOGE has limited resistance up to the 50-day SMA at $0.262, delivering a 40% profit from the current price. A rally beyond the moving average will be impeded by the June 25 high of $0.291, but it would confirm a break in the persistent downtrend since the May high.
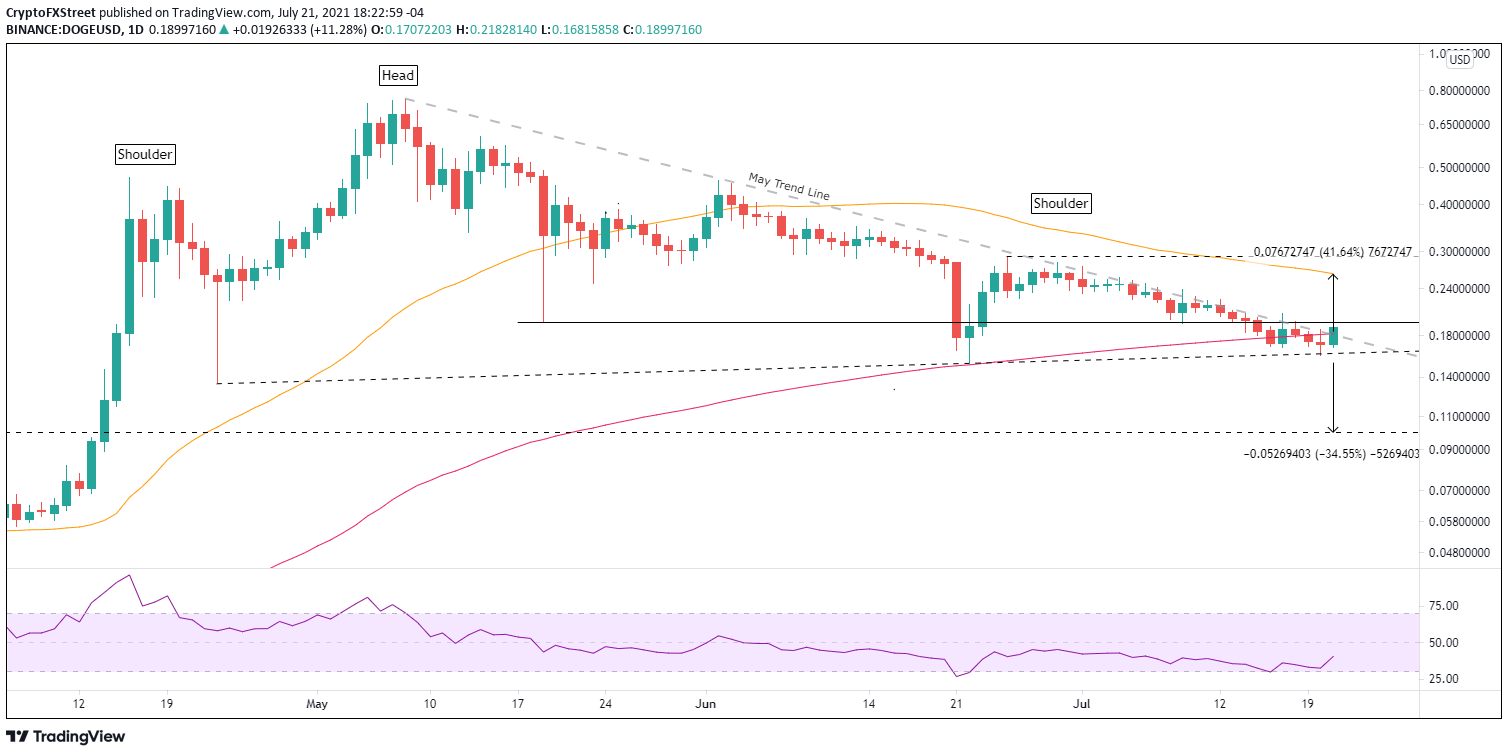
DOGE/USD daily chart
The potential for a bullish outcome will disappear if Dogecoin price logs a daily close below the June 22 low of $0.152, putting DOGE investors at risk of a plunge to the January 29 high of $0.100 and a 34% loss from the June 22 low. The April 23 low of $0.135 is the only obstacle to the bearish payoff.
Moreover, the loss would turn all the support levels mentioned above into resistance. As a result, erecting an intimidating barrier for Dogecoin price and dissolving aspirations of revisiting the May highs.
Today’s reversal of substantive gains downgrades the potential of a serious rally for Dogecoin price moving forward. Use the double bottom trigger price of $0.205 to clarify DOGE intentions in a cryptocurrency market void of the FOMO tailwinds.
Here, FXStreet's analysts evaluate where DOGE could be heading next.
Author

Sheldon McIntyre, CMT
Independent Analyst
Sheldon has 24 years of investment experience holding various positions in companies based in the United States and Chile. His core competencies include BRIC and G-10 equity markets, swing and position trading and technical analysis.


