Dogecoin Price Forecast: DOGE at an inflection point as momentum builds to the downside
- Dogecoin price is approaching the 200-day simple moving average (SMA) for the first time since June 22.
- DOGE head-and-shoulders neckline currently rests just below the 200-day SMA at $0.160.
- Meme token nears another oversold reading on the daily Relative Strength Index (RSI).

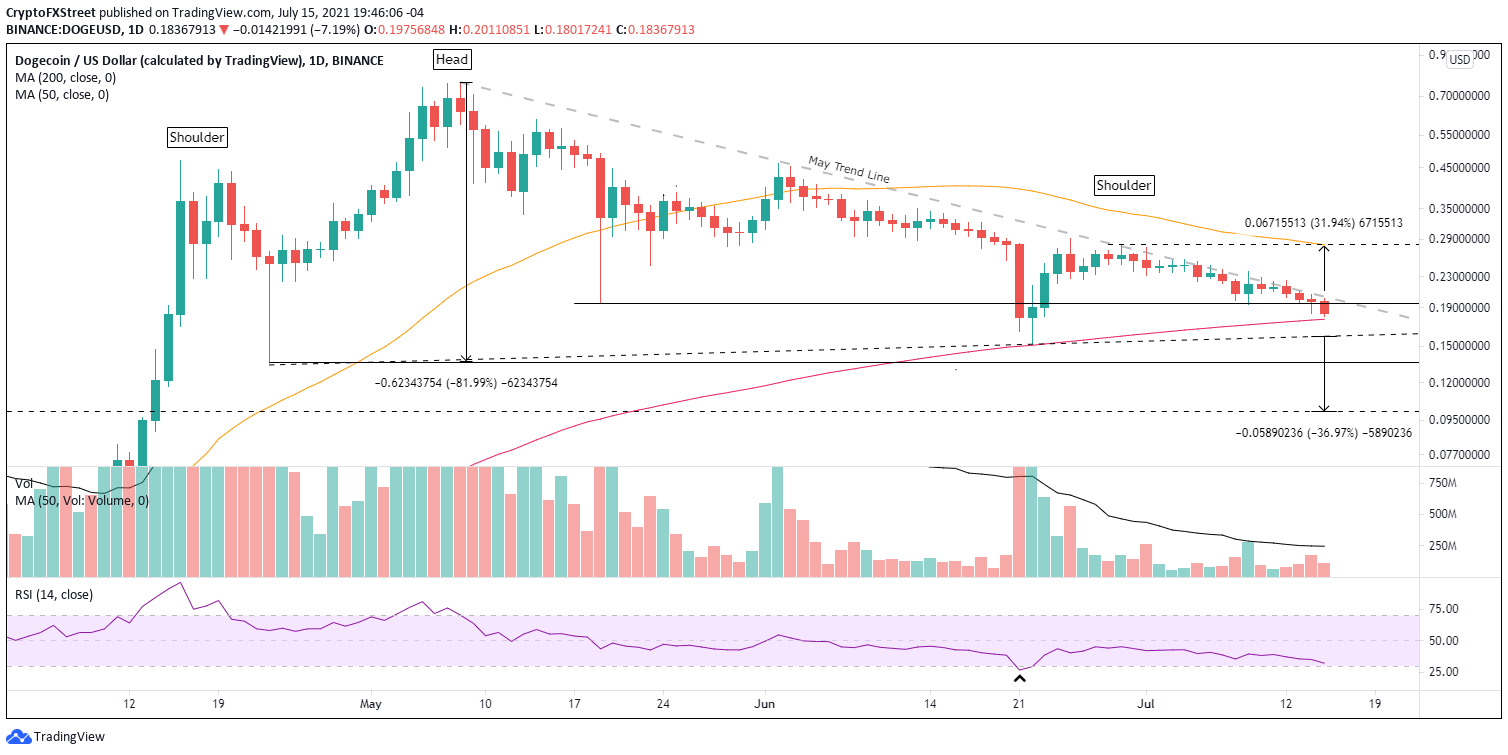
Dogecoin price rests at a critical inflection point with the May 19 low and May’s descending trend line pressing down, while the 200-day SMA tries to restrain the relentless selling pressure since June 29. As long as the trend line is insurmountable, DOGE will break below the strategically important moving average and will trigger the neckline of the head-and-shoulders pattern.
Dogecoin price has lost the trust of investors as it drifts lower
May’s descending trend line has impeded Dogecoin price strength since June 29, highlighted by the failure of DOGE to log one daily close above the trend line. The result has been completing the right shoulder of a complex head-and-shoulders pattern that originated in April.
The measured move of the head-and-shoulders formation is 82%, establishing a Dogecoin price target of $0.028. To provide perspective, a collapse of that size would smash the support inherent in the 200-day SMA, the June 22 low of $0.152, the April 23 low of $0.135, the 50-week SMA at $0.105 and the January 29 high of $0.100.
A decline of 82% from the neckline at $0.160 seems extreme even within the context of a cryptocurrency market under pressure. A more reasonable target for Dogecoin price is a test of the January 29 high of $0.100, equaling a 37% move from the current position of the neckline and 46% from the current price.
There is one problem with the remarkably bearish forecast. The daily RSI is already near an oversold reading, and the last time it did mark an oversold condition was on June 22. Moreover, since the beginning of 2019, the indicator has only dropped below 30 one other time before June, in March 2020.
DOGE/USD daily chart
If Dogecoin price can close above $0.210 on a daily basis, it would be the first confirmation that the slow drift below May's descending trend line has come to an end and position DOGE to explore the resistance framed by the confluence of the 50-day SMA at $0.280 with the June 29 high of $0.281. A rally to the 50-day SMA from the $0.210 trigger would yield a 30% gain for investors.
As a result of the building downside momentum and support and resistance levels crossing, Dogecoin price has reached an inflection point. How it resolves will likely have long-term ramifications for the DOGE story.
Here, FXStreet's analysts evaluate where DOGE could be heading next.
Author

Sheldon McIntyre, CMT
Independent Analyst
Sheldon has 24 years of investment experience holding various positions in companies based in the United States and Chile. His core competencies include BRIC and G-10 equity markets, swing and position trading and technical analysis.



