Dogecoin Price Forecast: Technical indicators show bearish divergence as holders book profits
- Dogecoin price hovers around $0.40 on Thursday after recovering from a pullback earlier this week.
- The RSI shows a bearish divergence, and the MACD suggests a sell signal.
- The NPL indicator shows DOGE holders are booking profit from recent gains, raising the selling pressure.

Dogecoin (DOGE) price hovers around the $0.40 level on Thursday after recovering from a pullback earlier this week. The technical outlook suggests a downward trend for DOGE, as the Relative Strength Index (RSI) shows a bearish divergence in the daily chart, and the Moving Average Convergence (MACD) indicator suggests a selling signal. Moreover, DOGE’s Network Realized Profit/Loss (NPL) records multiple spikes, indicating holders are booking profit from recent gains and raising the selling pressure.
Dogecoin is poised for a downturn as momentum indicators show bearish divergence
Dogecoin price reached a new yearly high of $0.48 on November 23 but failed to close above the $0.44 resistance level. After this failure, it declined more than 10% in the next three days until Tuesday. However, it recovered slightly on Wednesday and, at the time of writing on Thursday, hovers around $0.403.
The RSI indicator suggests a weakness in momentum in the daily chart. The higher high in the Dogecoin price formed on November 23 does not reflect the RSI lower high for the same period. This development is termed a bearish divergence, often leading to a trend reversal or short-term pullback. Moreover, the MACD indicator also showed a bearish crossover on Tuesday, suggesting a sell signal.
If DOGE’s pullback continues, it could extend the decline to retest the 61.80% Fibonacci retracement level, drawn from the November 3 low of $0.142 to the November 23 high of $0.480, at $0.350, which roughly coincides with the daily support level.
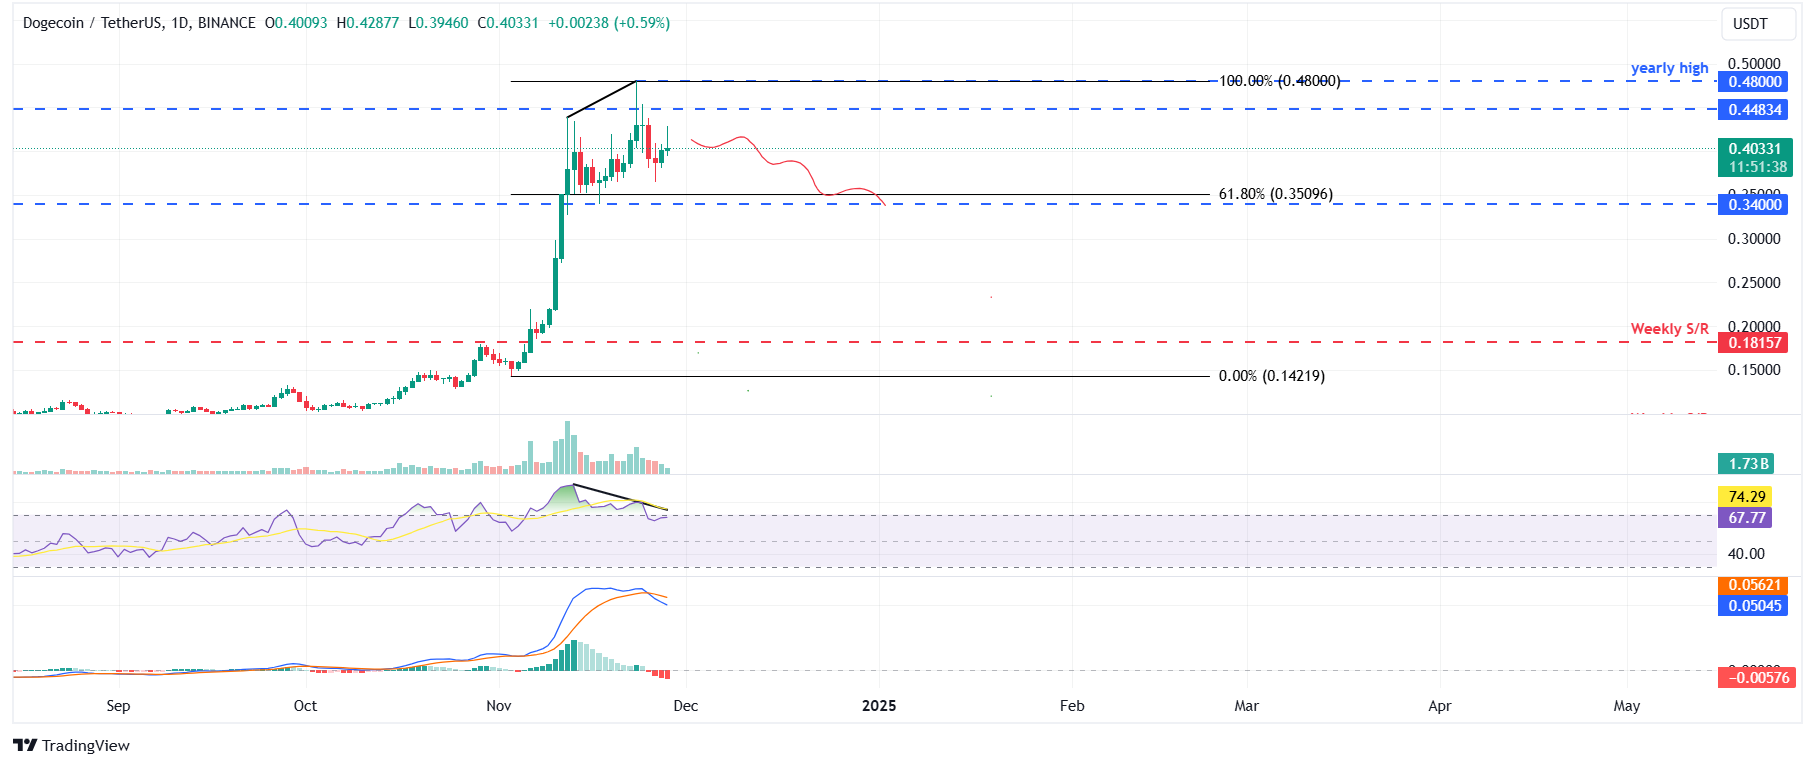
DOGE/USDT daily chart
Looking down on the memecoin’s on-chain metric further projects a bearish outlook. Santiment’s Network Realized Profit/Loss (NPL) indicator computes a daily network-level Return On Investment (ROI) based on the coin’s on-chain transaction volume. Simply put, it is used to measure market pain. Strong spikes in a coin’s NPL indicate that its holders are, on average, selling their bags at a significant profit. On the other hand, strong dips imply that the coin’s holders are, on average, realizing losses, suggesting panic sell-offs and investor capitulation.
In DOGE’s case, the metric has spiked multiple times since Monday and reached the highest yearly level on November 22. Similar spikes were seen in early April, after which Dogecoin price crashed. If history repeats, DOGE could see a similar decline in the upcoming days.
%20[16.55.43,%2028%20Nov,%202024]-638683971706221344.png)
Dogecoin Network Realized Profit/Loss chart. Source: Santiment
Author

Manish Chhetri
FXStreet
Manish Chhetri is a crypto specialist with over four years of experience in the cryptocurrency industry.


