Bitcoin Price Forecast: FUD in the market as Thanksgiving approaches

Bitcoin price today: $94,850
- Bitcoin price declines on Thursday after recovering from a pullback earlier this week.
- Investors remain cautious, recalling the 2020 ‘Thanksgiving Massacre,’ when Bitcoin plunged over 17% in a few hours.
- Reports highlight the bull market is not over, as BTC is not overvalued, and projects a target of $146K.
Bitcoin (BTC) price declines and falls below the $95,000 level on Thursday. After recovering from a pullback earlier this week, investors are wary of a repeat of the 2020 “Thanksgiving Massacre,” which saw a sudden 17% drop. Yet, optimism persists as reports suggest the bull market remains intact, projecting a potential target of $146K while indicating BTC is not overvalued.
Bitcoin price volatility ahead: ‘Thanksgiving pump’ or a ‘Thanksgiving Massacre’
Bitcoin’s recovery to close above $95,500 rekindles optimism of breaching the $100,000 milestone on Wednesday after a price pullback earlier this week. At the time of writing on Thursday, BTC declines and hovers around $94,850. However, investors remain cautious, recalling the 2020 ‘Thanksgiving Massacre’ when Bitcoin plunged over 17% in mere hours, highlighting the delicate balance of festive cheer and market volatility.
✨ #Bitcoin crashing below $16k, exactly 4 years ago. They called it the "Thanksgiving Day Massacre."
— The Bitcoin Historian (@pete_rizzo_) November 26, 2024
Everyone who bought the dip is up 480% pic.twitter.com/iCh3NlSI3a
Bitcoin eyes $146K mark as reports suggest BTC hasn’t hit overvalue levels
CryptoQuant weekly report highlights that BTC has not reached overvalued levels and projects a rally continuation, reaching $146K.
Although the price has corrected toward $91,000 this week, the graph below shows that valuation metrics still indicate a bull market and that BTC has yet to reach the overvalued levels that typically precede the end of a bull cycle.
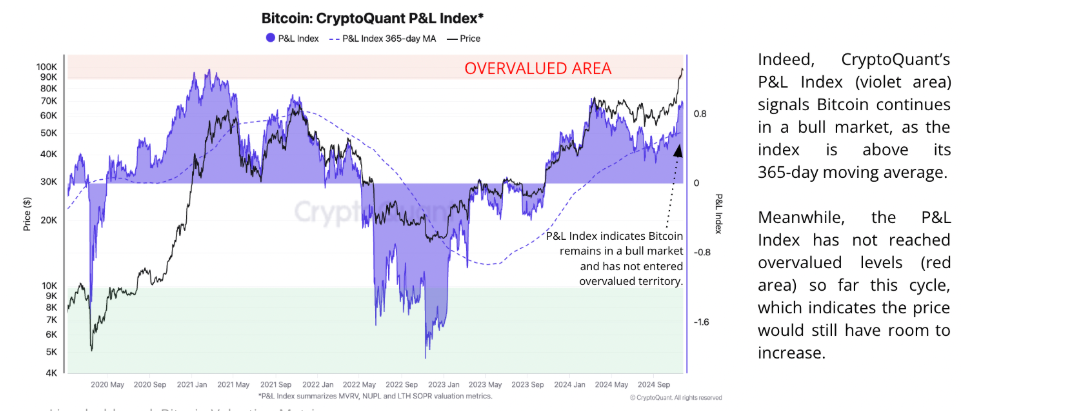
Bitcoin P&L Index chart. Source: CryptoQuant
The report further explained that Bitcoin’s top price target is currently $146,000 from a realized price valuation perspective (red line). This price band has acted as a top for Bitcoin's price in previous cycles, such as April–May 2021.
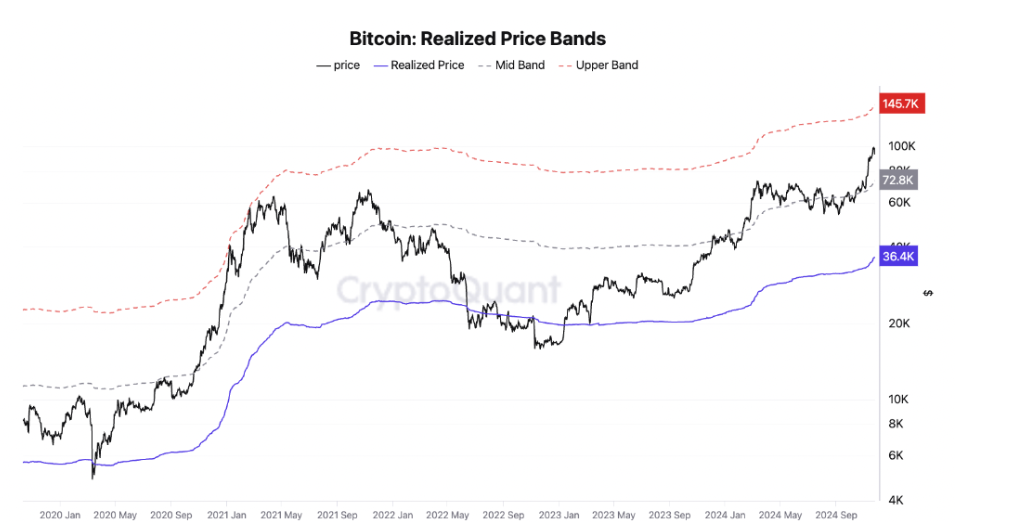
Bitcoin Realized Price Bands chart. Source: CryptoQuant
However, one metric that seems to indicate a short-term Bitcoin price correction is MicroStrategy’s stock price becoming overheated relative to the company’s Bitcoin holdings value. Indeed, MicroStrategy’s stock has increased by 113% since November 3 as the price of Bitcoin rallied towards $100k. However, based on the holdings’ value, the stock price has risen towards the upper end of its price bands.
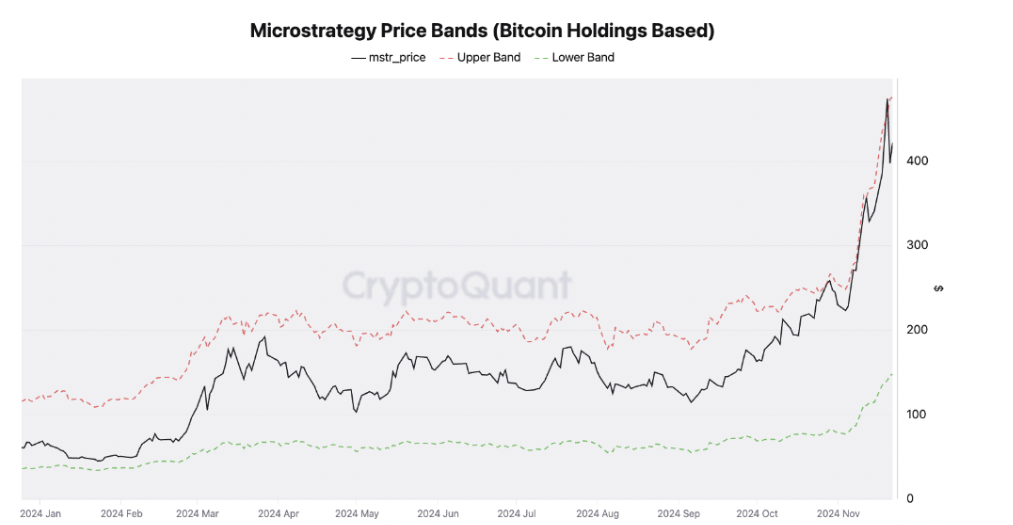
MicroStrategy Price Bands chart. Source: CryptoQuant
Lastly, institutional demand recovered slightly on Wednesday. According to Coinglass Exchange Traded Funds (ETF) data, US spot Bitcoin ETFs experienced a slight inflow of $103.00 million on Wednesday, breaking its two straight days of outflow this week. Bitcoin’s price could recover further if this inflow trend persists or accelerates.
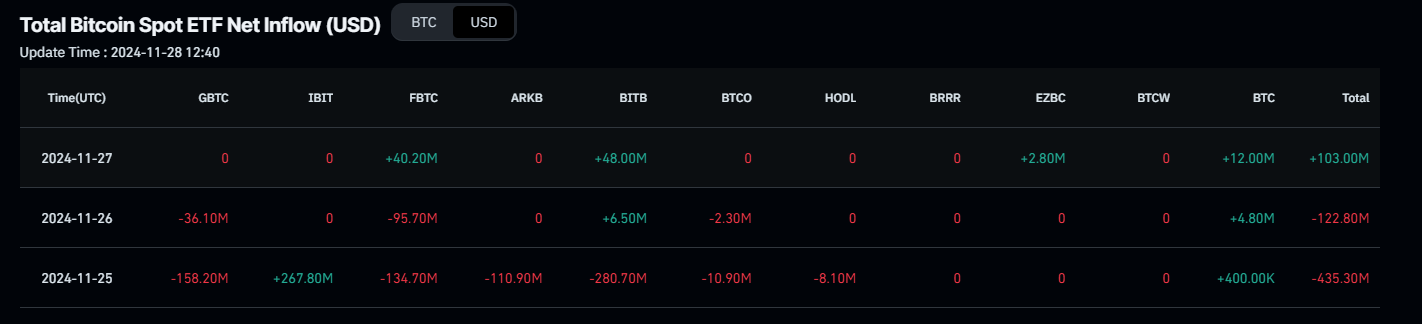
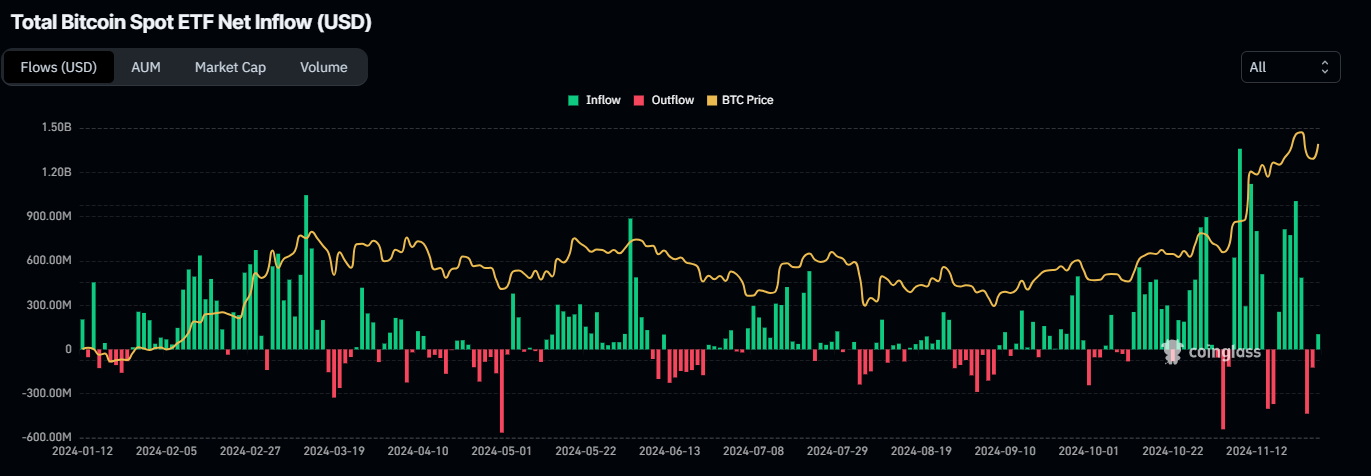
Total Bitcoin Spot ETF Net Inflow chart. Source: Coinglass
Bitcoin Price Forecast: Momentum indicators show signs of correction
Bitcoin price recovered on Wednesday after a recent pullback earlier this week. On Thursday, it trades slightly down around $94,850.
The Relative Strength Index (RSI) indicator suggests a weakness in momentum in the daily chart. The higher high in BTC’s price formed on November 22 does not reflect the RSI lower high for the same period. This development is termed a bearish divergence, often leading to a trend reversal or short-term pullback. Moreover, the Moving Average Convergence Divergence (MACD) indicator also showed a bearish crossover on Tuesday, signaling sell signals.
If BTC fails to recover and the pullback continues, it could extend the decline to retest its important psychological level of $90,000. A successful close below this level would extend an additional decline to test its next support level at $85,000.
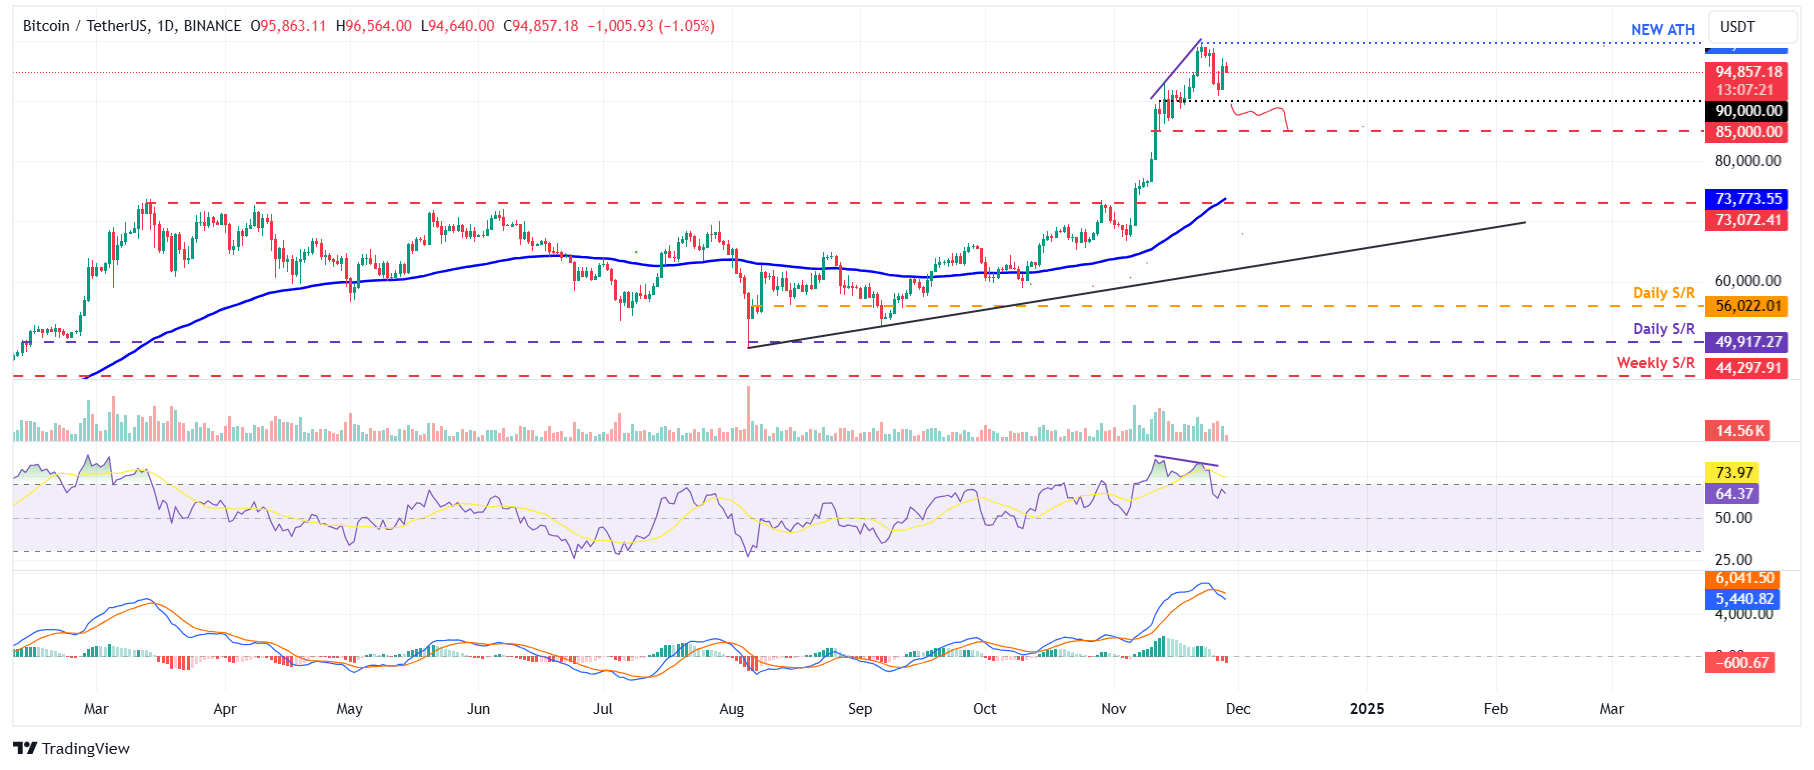
BTC/USDT daily chart
However, If BTC continues to recover, it could rally to reach its all-time high level of $99,588.
Bitcoin, altcoins, stablecoins FAQs
Bitcoin is the largest cryptocurrency by market capitalization, a virtual currency designed to serve as money. This form of payment cannot be controlled by any one person, group, or entity, which eliminates the need for third-party participation during financial transactions.
Altcoins are any cryptocurrency apart from Bitcoin, but some also regard Ethereum as a non-altcoin because it is from these two cryptocurrencies that forking happens. If this is true, then Litecoin is the first altcoin, forked from the Bitcoin protocol and, therefore, an “improved” version of it.
Stablecoins are cryptocurrencies designed to have a stable price, with their value backed by a reserve of the asset it represents. To achieve this, the value of any one stablecoin is pegged to a commodity or financial instrument, such as the US Dollar (USD), with its supply regulated by an algorithm or demand. The main goal of stablecoins is to provide an on/off-ramp for investors willing to trade and invest in cryptocurrencies. Stablecoins also allow investors to store value since cryptocurrencies, in general, are subject to volatility.
Bitcoin dominance is the ratio of Bitcoin's market capitalization to the total market capitalization of all cryptocurrencies combined. It provides a clear picture of Bitcoin’s interest among investors. A high BTC dominance typically happens before and during a bull run, in which investors resort to investing in relatively stable and high market capitalization cryptocurrency like Bitcoin. A drop in BTC dominance usually means that investors are moving their capital and/or profits to altcoins in a quest for higher returns, which usually triggers an explosion of altcoin rallies.
Author

Manish Chhetri
FXStreet
Manish Chhetri is a crypto specialist with over four years of experience in the cryptocurrency industry.


