Share:
  • Dogecoin price broke out of a descending triangle pattern on March 1.
  • Due to lack of volatility, as displayed by the Bollinger Bands, DOGE’s bull rally is put-off.
  • A decisive close above the no-trade zone will determine the meme coin’s direction.

Dogecoin price has been traversing the descending triangle formation for more than 20 days—however, the recent swing high lead to a bullish breakout. Now DOGE eyes a 50% upswing to $0.076.

Dogecoin price in search of volatility

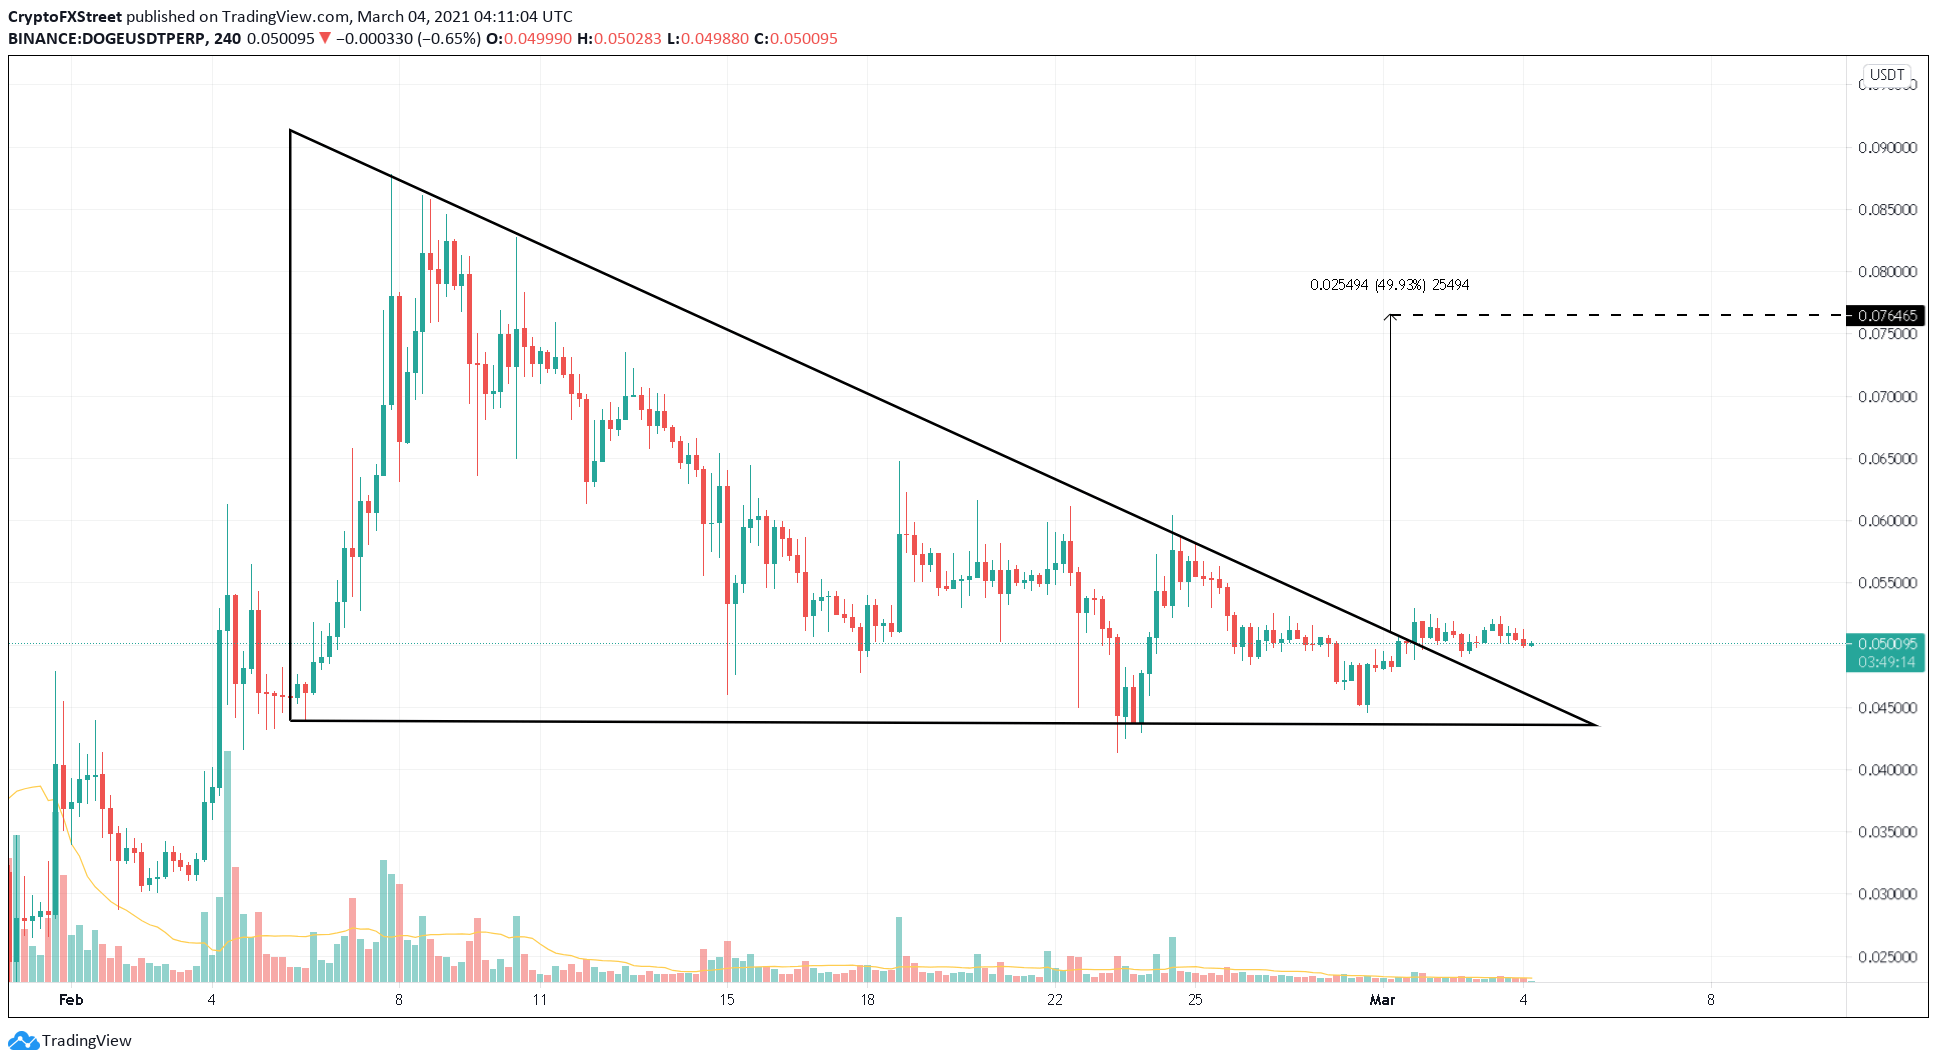
Dogecoin price has been consolidating, forming a series of lower highs that have bounced off a horizontal demand barrier at $0.043. Connecting these swing highs and flat support using trendlines results in a descending triangle pattern.

The technical formation forecasts a 50% upswing determined by measuring the distance between the pivot high and the horizontal support line and adding it to the breakout point at $0.050.

This target places DOGE at $0.076.

However, unlike in early January and February, Dogecoin price seems to be dead in the water, despite its recent breakout from consolidation.

DOGE/USDT 4-hour chart

DOGE/USDT 4-hour chart

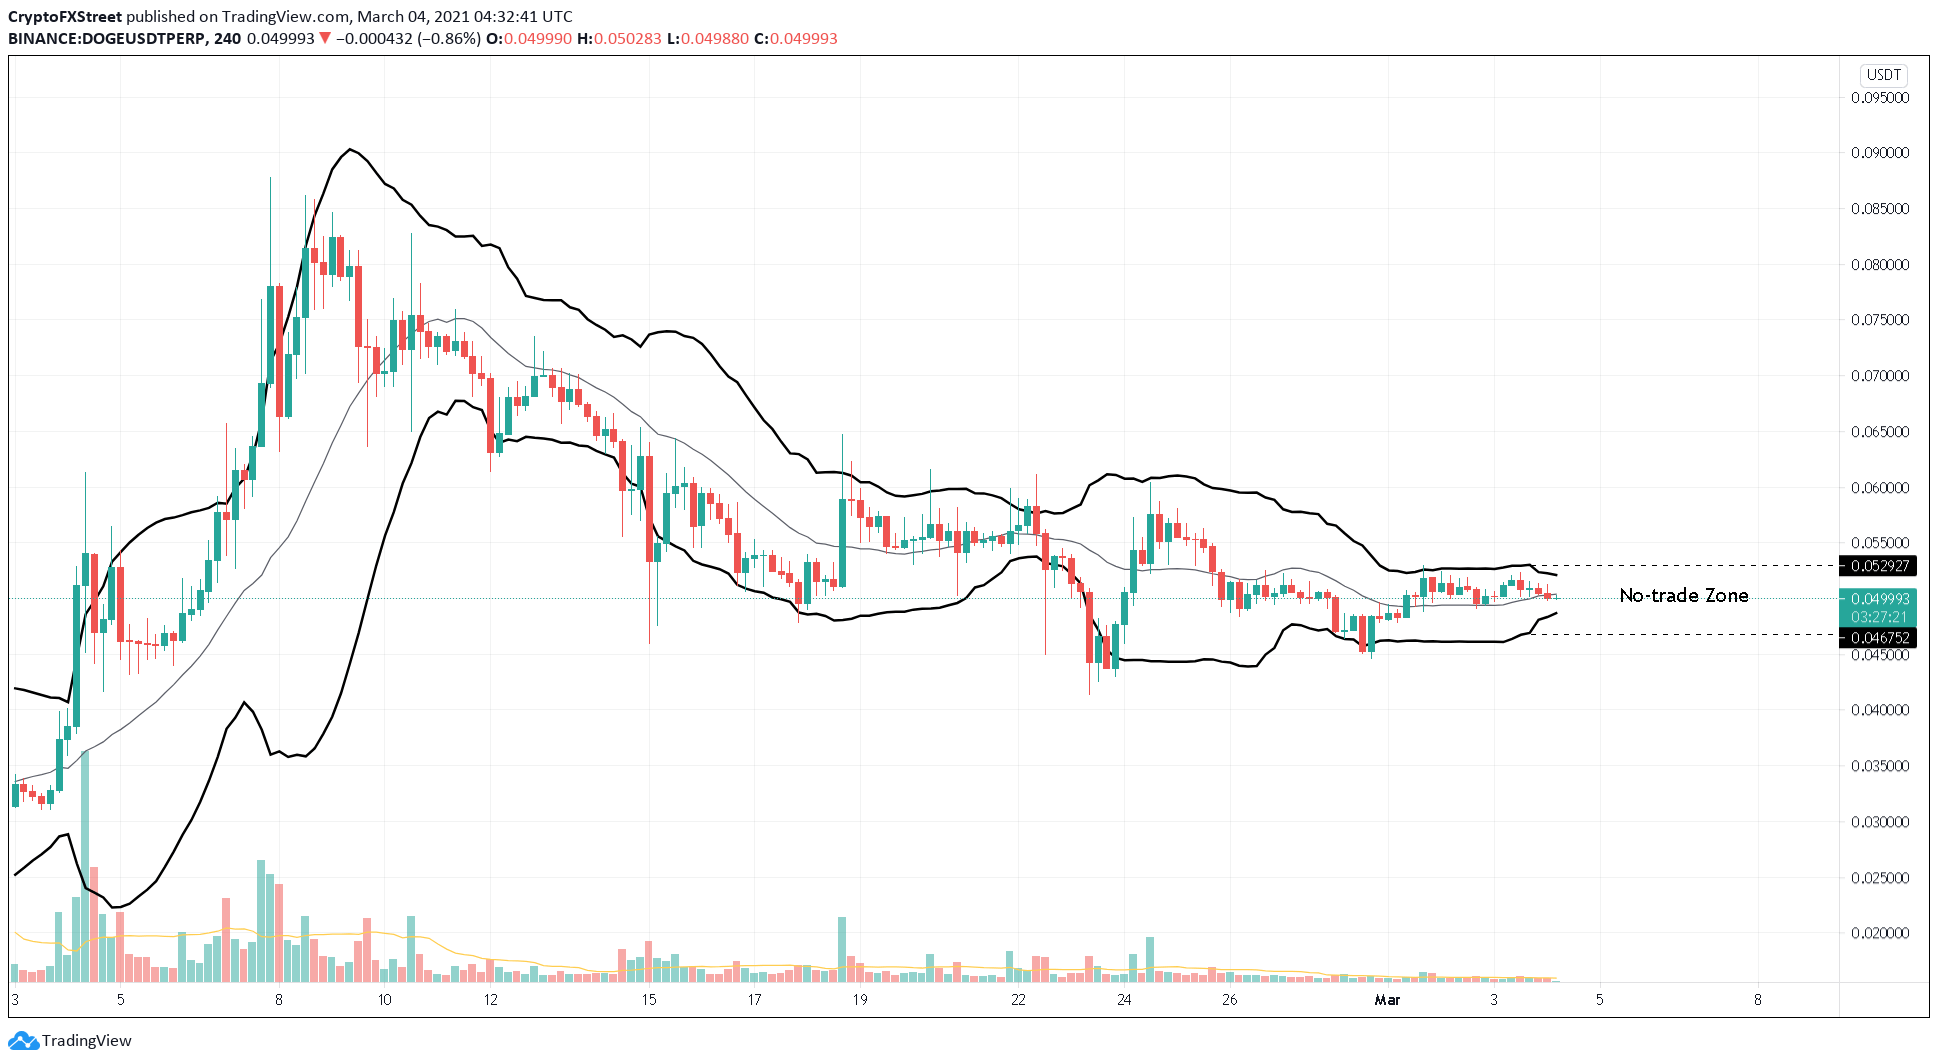
At the time of writing, Dogecoin price is getting squeezed by the Bollinger Bands. The reduction of distance between the upper and lower band indicates a period of low volatility, which explains DOGE’s lackluster performance.

So long as Dogecoin price trades within the no-trade zone that extends from $0.046 to $0.052, significant swings can’t be expected. However, a 4-hour candlestick close above the range confirms an upswing and the resurgence of volatility.

In such a case, DOGE could surge towards its intended target at $0.076.

DOGE/USDT 4-hour chart

DOGE/USDT 4-hour chart

On the flip side, if Dogecoin price slices through the lower range of the no-trade zone at $0.046, then a 12% downswing to $0.043 is possible. A spike in selling pressure here could invalidate the bullish thesis and lead to a steep 50% correction to $0.021.


Information on these pages contains forward-looking statements that involve risks and uncertainties. Markets and instruments profiled on this page are for informational purposes only and should not in any way come across as a recommendation to buy or sell in these assets. You should do your own thorough research before making any investment decisions. FXStreet does not in any way guarantee that this information is free from mistakes, errors, or material misstatements. It also does not guarantee that this information is of a timely nature. Investing in Open Markets involves a great deal of risk, including the loss of all or a portion of your investment, as well as emotional distress. All risks, losses and costs associated with investing, including total loss of principal, are your responsibility. The views and opinions expressed in this article are those of the authors and do not necessarily reflect the official policy or position of FXStreet nor its advertisers. The author will not be held responsible for information that is found at the end of links posted on this page.

If not otherwise explicitly mentioned in the body of the article, at the time of writing, the author has no position in any stock mentioned in this article and no business relationship with any company mentioned. The author has not received compensation for writing this article, other than from FXStreet.

FXStreet and the author do not provide personalized recommendations. The author makes no representations as to the accuracy, completeness, or suitability of this information. FXStreet and the author will not be liable for any errors, omissions or any losses, injuries or damages arising from this information and its display or use. Errors and omissions excepted.

The author and FXStreet are not registered investment advisors and nothing in this article is intended to be investment advice.

Join Telegram

Follow us on Telegram

Stay updated of all the news

Join Telegram

Recommended content


Follow us on Telegram

Stay updated of all the news

Join Telegram

Recommended Content

Editors’ Picks

Kyber exploiter asks for complete control of all assets after nearly $50 million exploit

Kyber exploiter asks for complete control of all assets after nearly $50 million exploit

Kyber network exploiter drained the protocol’s liquidity pools of nearly $50 million on November 22. The team behind Kyber managed to recover $4.67 million and communicated with the exploiter for the remainder of assets. 

More Cryptocurrencies News

Chainlink supply on exchanges hits lowest point since 2020, with LINK staking v0.2 launch

Chainlink supply on exchanges hits lowest point since 2020, with LINK staking v0.2 launch

Chainlink supply on exchanges declined to a level previously seen in February 2020. LINK staking v0.2 went live on November 28, attracting 68% of staked tokens from v0.1. 

More Chainlink News

Bitcoin Spot ETF applications see amendments, holders await January batch approval

Bitcoin Spot ETF applications see amendments, holders await January batch approval

Bitcoin Spot ETF race has late entrants and updates from BlackRock, according to James Seyffart. BTC Spot ETF approval anticipation has fueled a rally in both spot and futures markets. 

More Bitcoin News

Ethereum Price Prediction: ETH top-down analysis hints upside is capped at $2,500

Ethereum Price Prediction: ETH top-down analysis hints upside is capped at $2,500

Ethereum price trades in a clear consolidative trend on the weekly time frame between $1,933 and $2,141 barriers. The daily chart for ETH shows a sweep of Monday’s high is likely to be followed by a sweep of Monday’s low at $1,985.

More Ethereum News

Three key BTC accumulation levels before ETF approval in January 2024

Three key BTC accumulation levels before ETF approval in January 2024

Bitcoin, from a high time-frame perspective, has been in an up-only trend since the start of 2023. BTC has ignored many sell signals due to the likelihood of an Exchange-Traded Fund approval. With the holidays around the corner, falling liquidity could see BTC discounted from its current level, hovering around the $37,000 region.

Read full analysis

BTC

ETH

XRP