Dogecoin Price Forecast: DOGE goes through a period of price consolidation
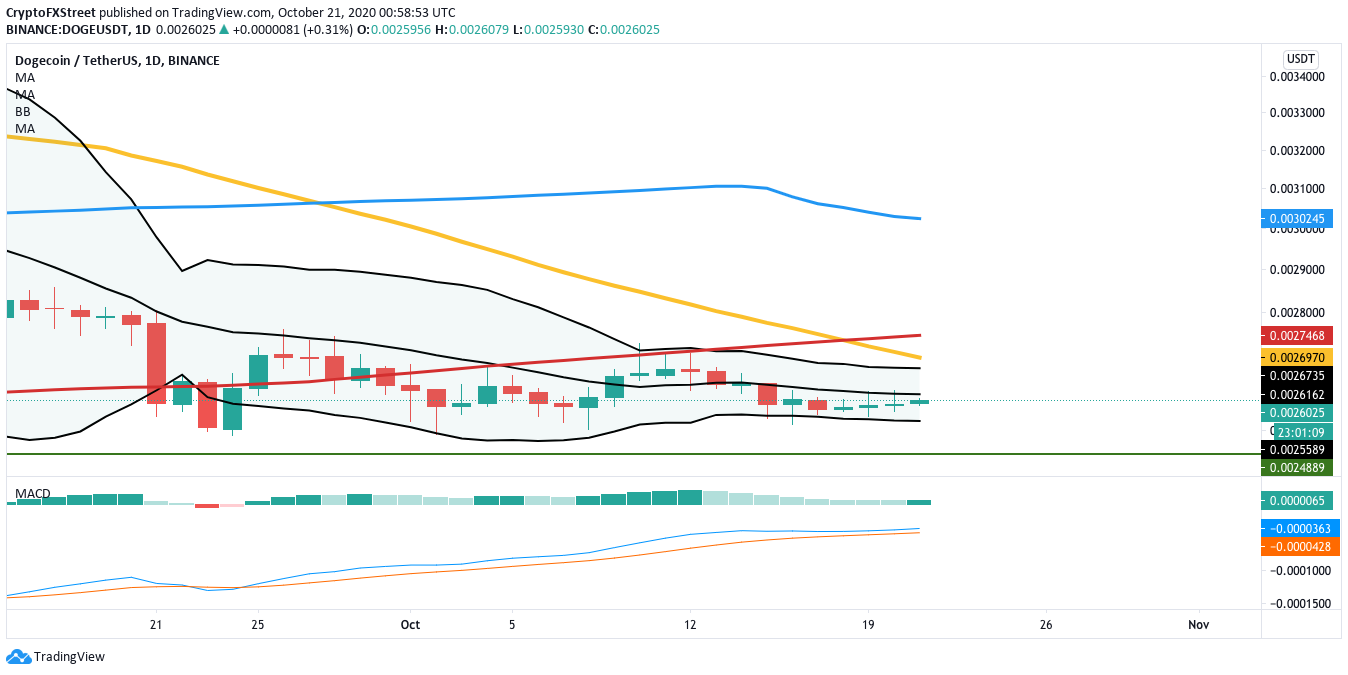
- The Bollinger Band in DOGE’s daily chart has started squeezing, indicating a low price volatility period.
- Dogecoin currently faces significant resistance at the 50-day SMA ($0.0027).

DOGE reached a high of 0.00478 in July 2020 and has been on a downward trajectory since then. The price has currently reached 0.0026 and is going through a consolidation period. This is indicated by the Bollinger Bands, which have started squeezing.
DOGE/USDT daily chart
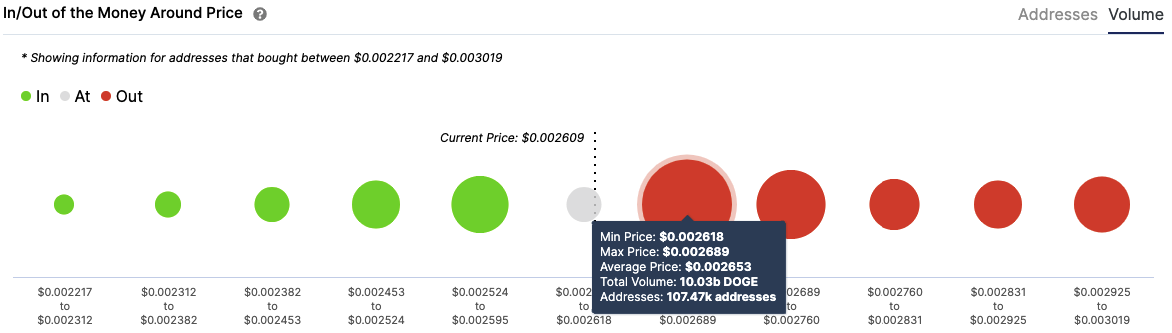
As per the IOMAP, DOGE/USD faces significant resistance at the 50-day SMA ($0.0027). Previously, at this level, 107,500 addresses had purchased 10 billion DOGE tokens. There is a lack of healthy support levels on the downside, so any downward movement could be borderline catastrophic.
DOGE IOMAP
However, two things show that the eventual market breakout is going to be bullish. Firstly the MACD indicates that the market momentum is buyer-friendly. Secondly, the weekly chart has flashed a buy signal, so upward movement is eventually expected.
DOGE/USDT weekly chart
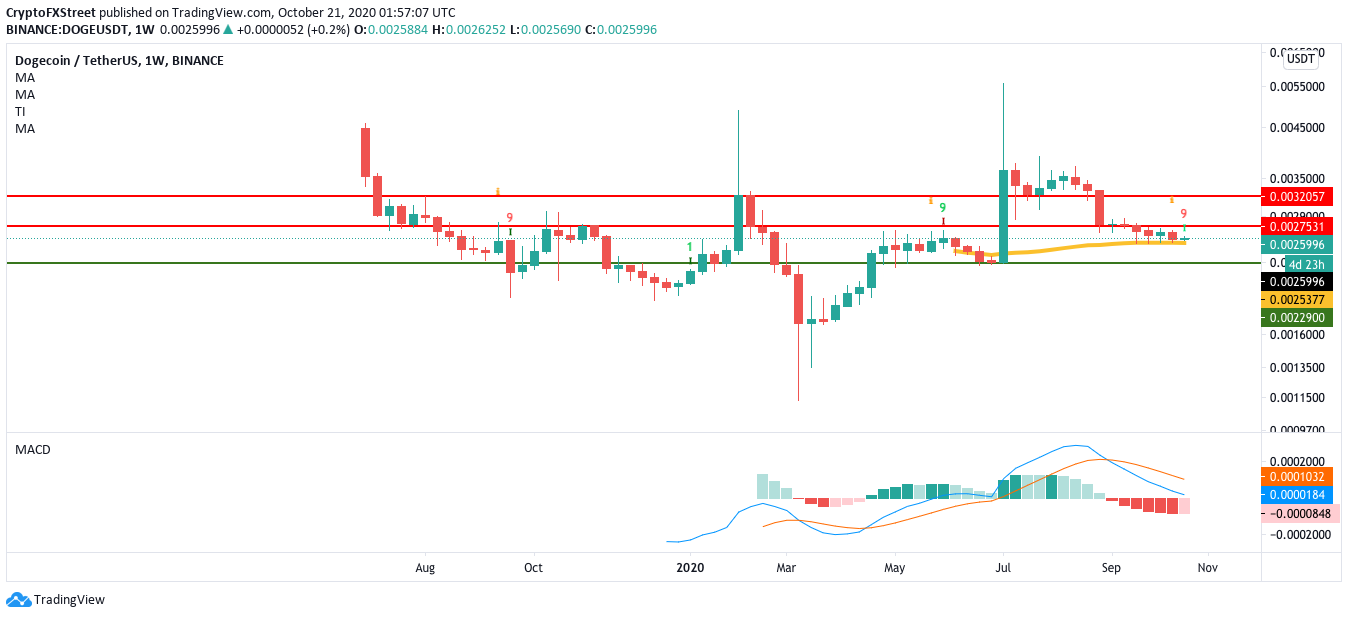
As per the chart, one can expect DOGE/SUDT to reach the $0.00275 level. A break above that level can expect the buyers to reach the $0.0032 resistance level. On the downside, the price has strong support at the 50-bar SMA.
The Flipside: Can the bears take control
If the price experiences a bearish breakout, it will probably drop till the $0.0025 support line. As per the IOMAP, any break below this level will probably take the price below $0.0022. This is further corroborated by the weekly chart, which shows strong support at the 50-bar SMA ($0.0025) and $0.0022.
Key price levels to watch
For the DOGE buyers, the key resistance barrier lies at the 50-day SMA ($0.0027). A break above this level will take the price to the 200-day SMA ($0.275).
The main price level for the bears is at the $0.0025 support and $0.0022 support walls.
Author

Rajarshi Mitra
Independent Analyst
Rajarshi entered the blockchain space in 2016. He is a blockchain researcher who has worked for Blockgeeks and has done research work for several ICOs. He gets regularly invited to give talks on the blockchain technology and cryptocurrencies.


