Dogecoin Price Forecast: DOGE aims higher, but challenges remain
- Dogecoin price falters and falls below the lower trend line of a symmetrical triangle pattern.
- DOGE cannot close above May’s declining trend line, reinforcing its importance.
- 23.60% Fibonacci retracement hovers above, strengthened by multiple daily price lows through May and June.

Dogecoin price rally from the 200-day simple moving average (SMA) marked a bullish departure from the weakness that branded price action through May and June. Currently, DOGE is drifting below the lower trend line of a symmetrical triangle pattern. It has not been conclusive, leaving the potential for a quick reversal and breakout to the upside.
Dogecoin price wants higher prices, but levels are intervening
Dogecoin price closed 2Q up 375%, placing it at the top of the internal watchlist, while Bitcoin price fell -40%. It is a surprising stat considering the depth of the May-June correction.
On June 22, Dogecoin price initiated a compelling rally off the 200-day SMA at $0.150 with above-average volume and followed by a 23% gain on June 23, the largest up day since the 25% gain on May 13. The notable jump in DOGE volume combined with the conviction of the rebound from the strategically important moving average points to prominent investor interest as big money tends to gravitate towards actionable support levels that offer great value.
The significance of the bullish bid quickly lifted Dogecoin price to the intersection of May’s declining trend line at $0.288 with the 23.60% retracement of the May-June correction at $0.296. Since the June 25, high DOGE has coiled, forming a symmetrical triangle pattern and releasing the price compression of the rally. As a continuation pattern, it is suggesting better price outcomes for the meme token.
The DOGE measured move, based on the width of the formation, is 23%. A price jump of that magnitude would yield a Dogecoin price target of $0.335, surpassing the 50-day SMA at $0.330.
However, today’s drift below the triangle’s lower trend line puts the bullish narrative at risk, especially if the weakness accelerates in the hours ahead. A daily close above the trend line would hint that the dip was a bear trap, and Dogecoin price will seek higher prices.
Also critical for DOGE is overcoming May’s declining trend line, a point of struggle between bulls and bears for the last five days.
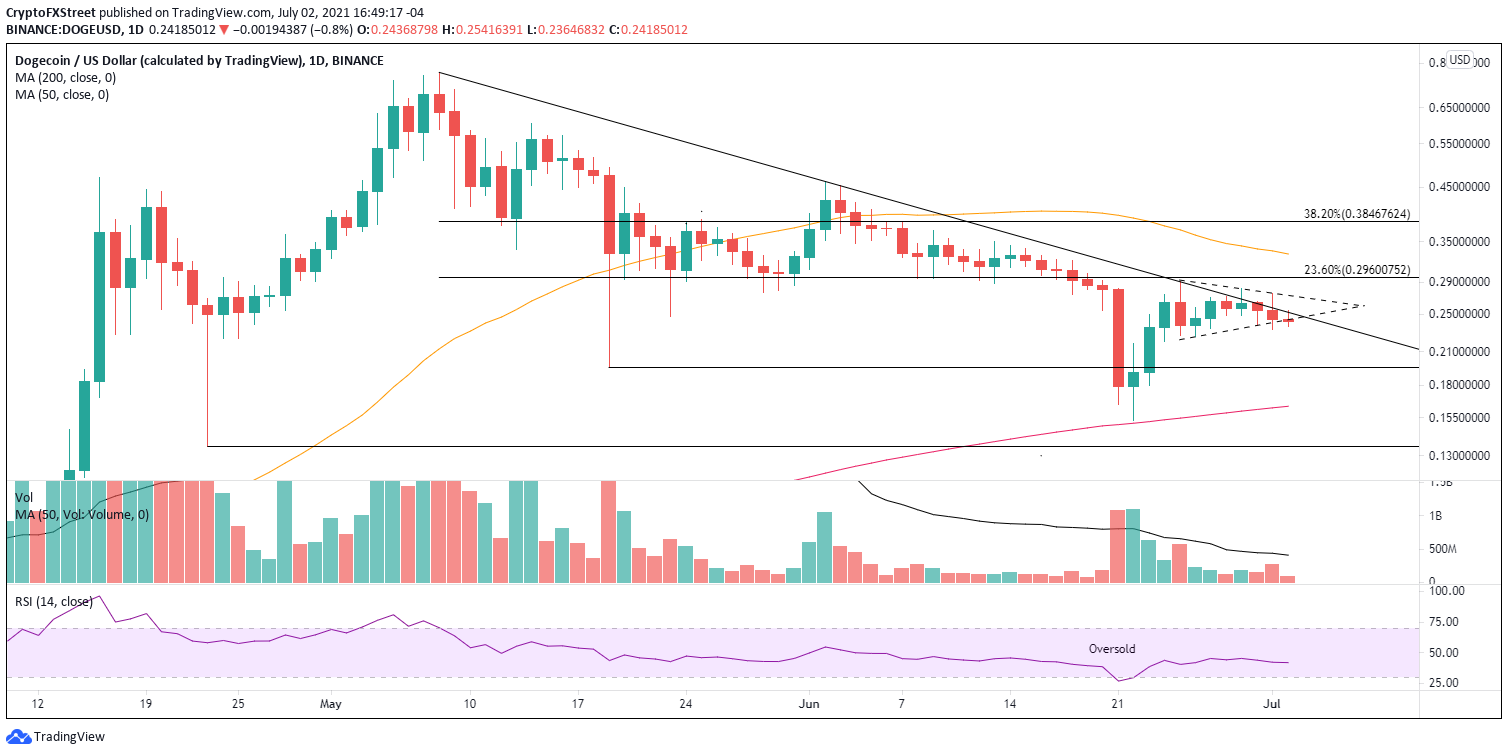
DOGE/USD daily chart
If the Dogecoin price dip below the triangle’s trend line is sustained into the close, it will immediately signify that DOGE is preparing to test the May 19 low of $0.195. A failure at the May 19 low will quickly direct the digital asset to the 200-day SMA at $0.163 and a sweep of the June 22 low of $0.152, logging a 38% decline.
The compelling response to the 200-day SMA by Dogecoin price was lead by prominent investors. However, whether DOGE will extend those gains through a breakout from a symmetrical triangle pattern or revisit the lows mentioned above remains unclear.
Despite the mild dip today, the outlook remains bullish until the dip turns into a sell-off.
Here, FXStreet's analysts evaluate where DOGE could be heading next with a brief technical and on-chain analysis on Dogecoin price.
Author

Sheldon McIntyre, CMT
Independent Analyst
Sheldon has 24 years of investment experience holding various positions in companies based in the United States and Chile. His core competencies include BRIC and G-10 equity markets, swing and position trading and technical analysis.


