Dogecoin Price Forecast: DOGE outperforms in Q2, positioned to target higher prices
- Dogecoin price burst has now evolved into a minor symmetrical triangle pattern, suggesting a continuation of the advance.
- DOGE struggles to overcome the extreme barrier defined by May’s declining trend line.
- 50-day simple moving average (SMA) is the next resistance level if the triangle resolves the upside.

Dogecoin price rally from the 200-day SMA is a bullish start to a sustainable advance moving forward. In the short term, DOGE needs to resolve the symmetrical triangle embracing price for the last five trading days. A resolution to the upside would yield a 25% gain and a test of the 50-day SMA. A moving average that the meme token has not tested since June 5.
Dogecoin price brings the heat, despite the volatility
At the time of writing, Dogecoin price is on pace to close the quarter up over 370%, placing it at the top of the internal watchlist, while Bitcoin price is down -40%. A remarkable feat considering the size of the May-June DOGE correction. The rally from June 22 has been instrumental in achieving the gain.
Dogecoin price mounted a serious rally off the 200-day SMA at $0.150 on June 22 with above-average volume followed by the best day since the 25% gain on May 13. The spike in DOGE volume and the buying conviction at the strategically important moving average points to interest from prominent investors as big money bids tend to gravitate towards actionable support levels that offer generous value.
The impact of the noteworthy bid lifted Dogecoin price to the merger of May’s declining trend line at $0.288 with the 23.60% Fibonacci extension of the May-June correction at $0.296. Since the June 25 high DOGE has transitted sideways, releasing any price compression and forming a symmetrical triangle pattern. A pattern that is generally classified as a continuation pattern.
The measured move is 25%, and it equates to a target of $0.345, just slightly above the 50-day SMA at $0.338. If the cryptocurrency market also captures a more substantial bid, Dogecoin price may extend the breakout from the triangle to the 38.2% retracement at $0.384, offering a 40% gain to DOGE investors.
A rally beyond the 38.2% retracement will be a challenge due to the cluster of price congestion around the price level going back to late May and early June. Nevertheless, it will put Dogecoin price on the right side of the instrumental moving averages and, as a result, providing a basis of support when weakness does hit DOGE.
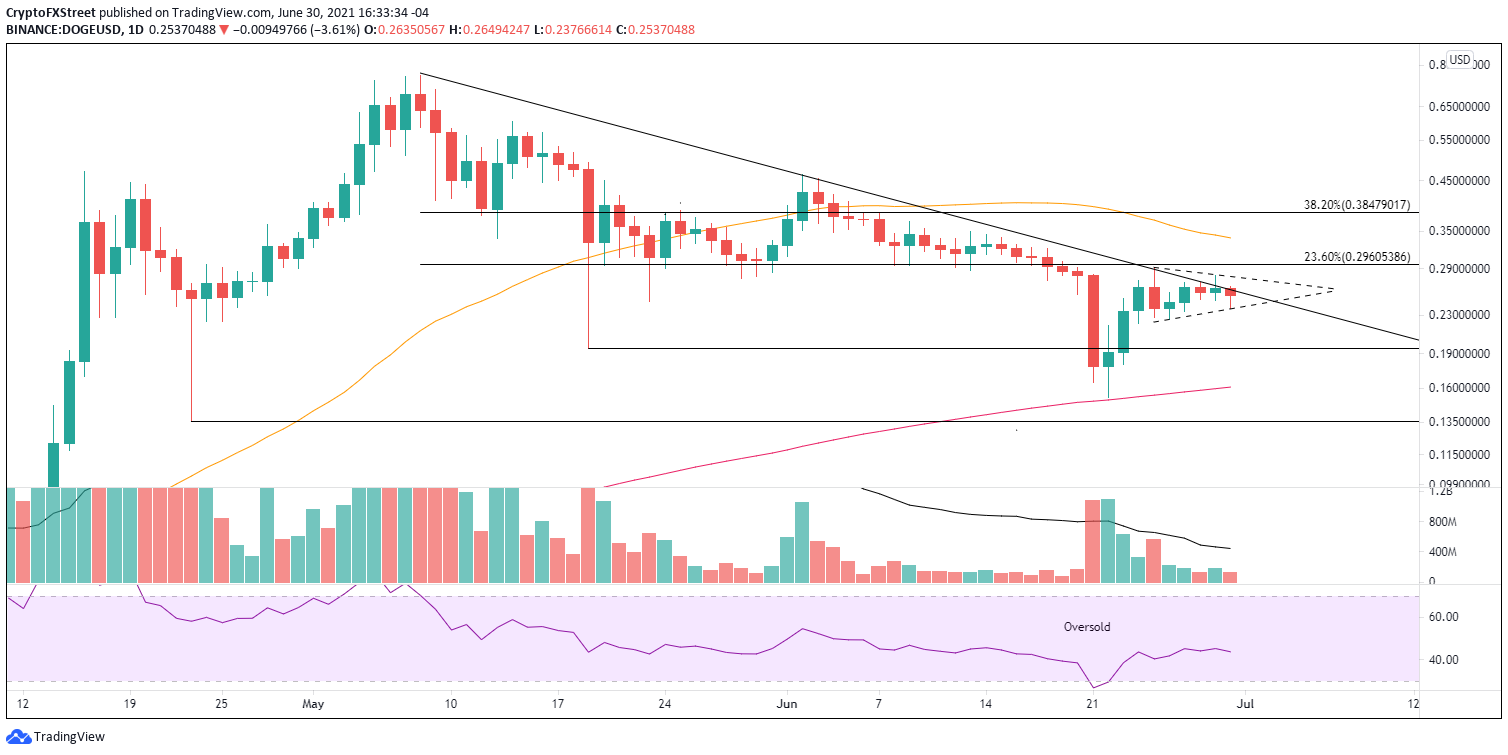
DOGE/USD daily chart
If Dogecoin price resolves the symmetrical triangle to the downside, it will also be a measured move of 25%, but the eventual target is approximately $0.178. The drop would bust the support offered by the May 19 low of $0.195 and leave DOGE close to the 200-day SMA once again. A failure to capture support at the widely followed average will guarantee a sweep of the June 22 low of $0.152.
Dogecoin price has a headstart on most cryptocurrencies. The dominant response to the 200-day SMA suggests that more prominent investors were trafficking at those levels, providing some shade if selling hits DOGE in the short term. Overall, the outlook is tilted bullish, but there remains potential for interference from the sometimes wicked gyrations of the cryptocurrency market.
Author

Sheldon McIntyre, CMT
Independent Analyst
Sheldon has 24 years of investment experience holding various positions in companies based in the United States and Chile. His core competencies include BRIC and G-10 equity markets, swing and position trading and technical analysis.


