Dogecoin price event approaches, as DOGE is pushed into a corner
- Dogecoin price embarrassed by the persistent resistance of May’s descending trend line, currently at $0.229.
- May 19 low of $0.195 composes a new level of support for the meme token.
- DOGE 200-day simple moving average (SMA) at $0.171 provides an additional layer of support if weakness accelerates.

Dogecoin price rebound from the 200-day SMA on June 22 spoke to the demand of prominent investors. Still, the rally quickly failed at May's descending trend line, and it has remained the imposing resistance against any daily price strength. As a result, DOGE has slowly deteriorated, putting the May 19 low in play and forcing the digital asset to decide its fate in the next five days.
Dogecoin price frustrated and confused
The inconclusive price action since the rally high on June 25 at $0.291 has been matched by a complete evacuation of trading volume, indicating a lack of interest in Dogecoin price at the current levels, and reinforced by an altcoin space struggling to overcome bearish price structures.
Critical to the Dogecoin price outlook or narrative is the dominance of May’s descending trend line that began on May 8 and continued through the early-June high. The notable resistance is exemplified by the interaction with DOGE over the last 11 trading sessions. More specifically, the digital asset has recorded seven failed rally attempts above the trend line over the last 11 trading sessions.
The result of the Dogecoin price action highlighted by the trend line resistance and the emerging support generated by the May 19 low is that DOGE is being cornered into a narrowing space (highlighted in green) that should resolve over the next five days. How the cryptocurrency resolves from the mini-triangle will dictate the narrative moving forward.
A DOGE daily close below the May 19 low of $0.195 would instigate a decline to the persuasive support of the 200-day SMA at $0.171 and potentially to the Anchored VWAP from January 28 at $0.155, or even a sweep of the June 22 low of $0.152.
Outstanding support also reigns at the April 23 hammer candlestick low of $0.135, representing a 40% decline from the current Dogecoin price.
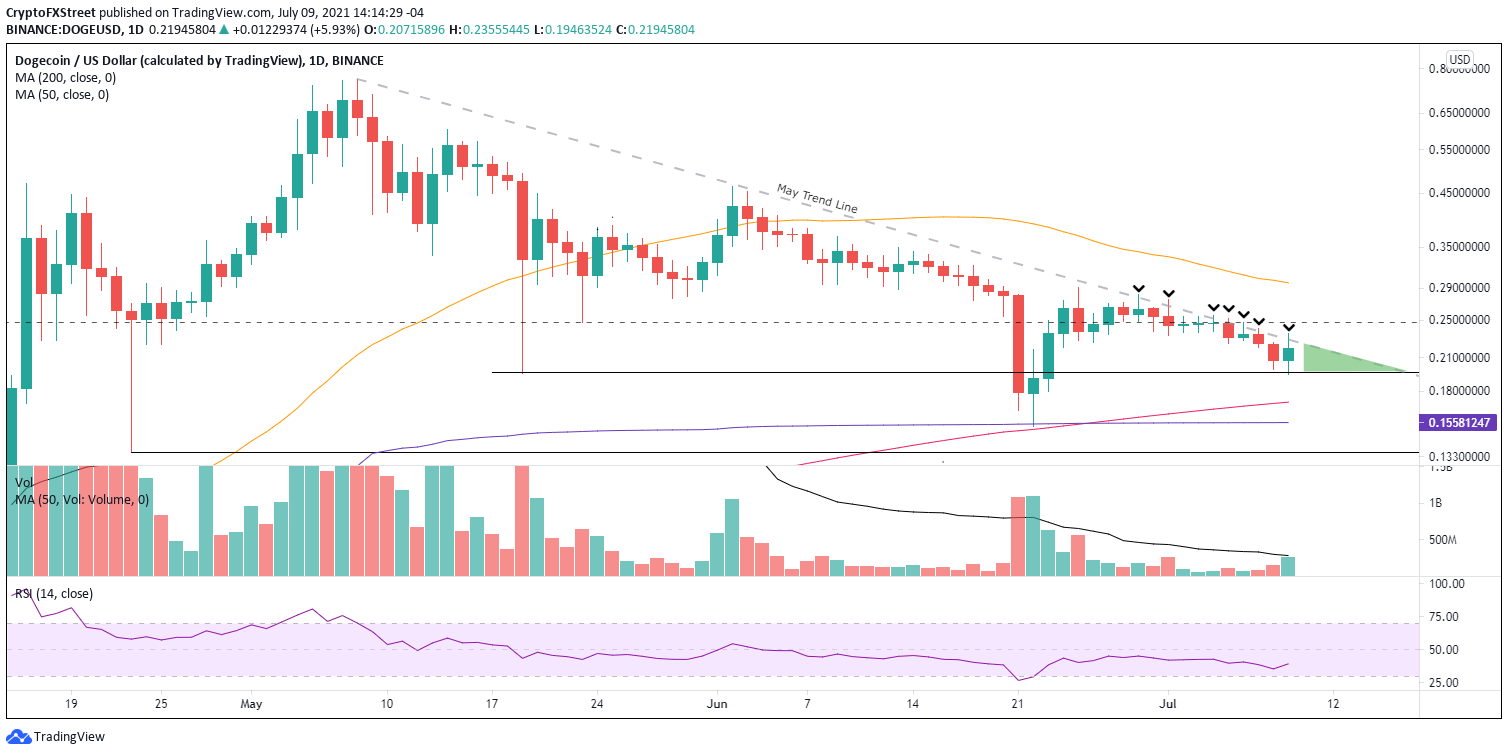
DOGE/USD daily chart
However, should Dogecoin price finally lock in a daily close above May’s descending trend line, currently at $0.230, DOGE speculators can forecast better outcomes. The first layer of resistance is the May 23 low of $0.246, followed by the declining 50-day SMA at $0.330. A successful resolution of the resistance at the 50-day SMA proposes a continuation of the rally to the June 2 high of $0.463, yielding a 105% gain from the position of the trend line today.
Indeed, Dogecoin price is being challenged by the descending trend line, but the emergence of the May 19 low as support has forced DOGE into a corner (highlighted in green) that should resolve soon. At this point, it is difficult to discern the final trajectory, but investors should wait for the altcoin to prove itself by triggering one of the price points articulated above.
Here, FXStreet's analysts evaluate where DOGE could be heading next.
Author

Sheldon McIntyre, CMT
Independent Analyst
Sheldon has 24 years of investment experience holding various positions in companies based in the United States and Chile. His core competencies include BRIC and G-10 equity markets, swing and position trading and technical analysis.


