Dogecoin-killer Shiba Inu bullish reversal pattern could launch SHIBA more than 100%
- Shiba Inu price hits the bottom of a falling wedge pattern.
- Candlestick and Point & Figure charts both illustrate higher prices incoming.
- Downside risks do exist but are very limited.

Shiba Inu price has been in a clear downtrend for several months, with little in the form of any reprieve. However, bulls are likely to take over very soon and create an intense short squeeze that could rally SHIBA to levels not seen since October 2021.
Shiba Inu price positioned for a significant reversal towards prior all-time highs
Shiba Inu price action on its daily Ichimoku chart shows little initial reason to anticipate any bullish price action soon. Despite that, the oscillator values show the lows for SHIBA are likely in, and a reversal may be near.
The Relative Strength Index (RSI) remains in bear market conditions, but clear planing of the RSI line against the first oversold level at 30 suggests strong support is present. Additionally, the Composite Index has flattened out and begun an almost imperceptible slope higher with the line at an angle suggesting a cross above its fast moving average will occur today or tomorrow – a bullish event.
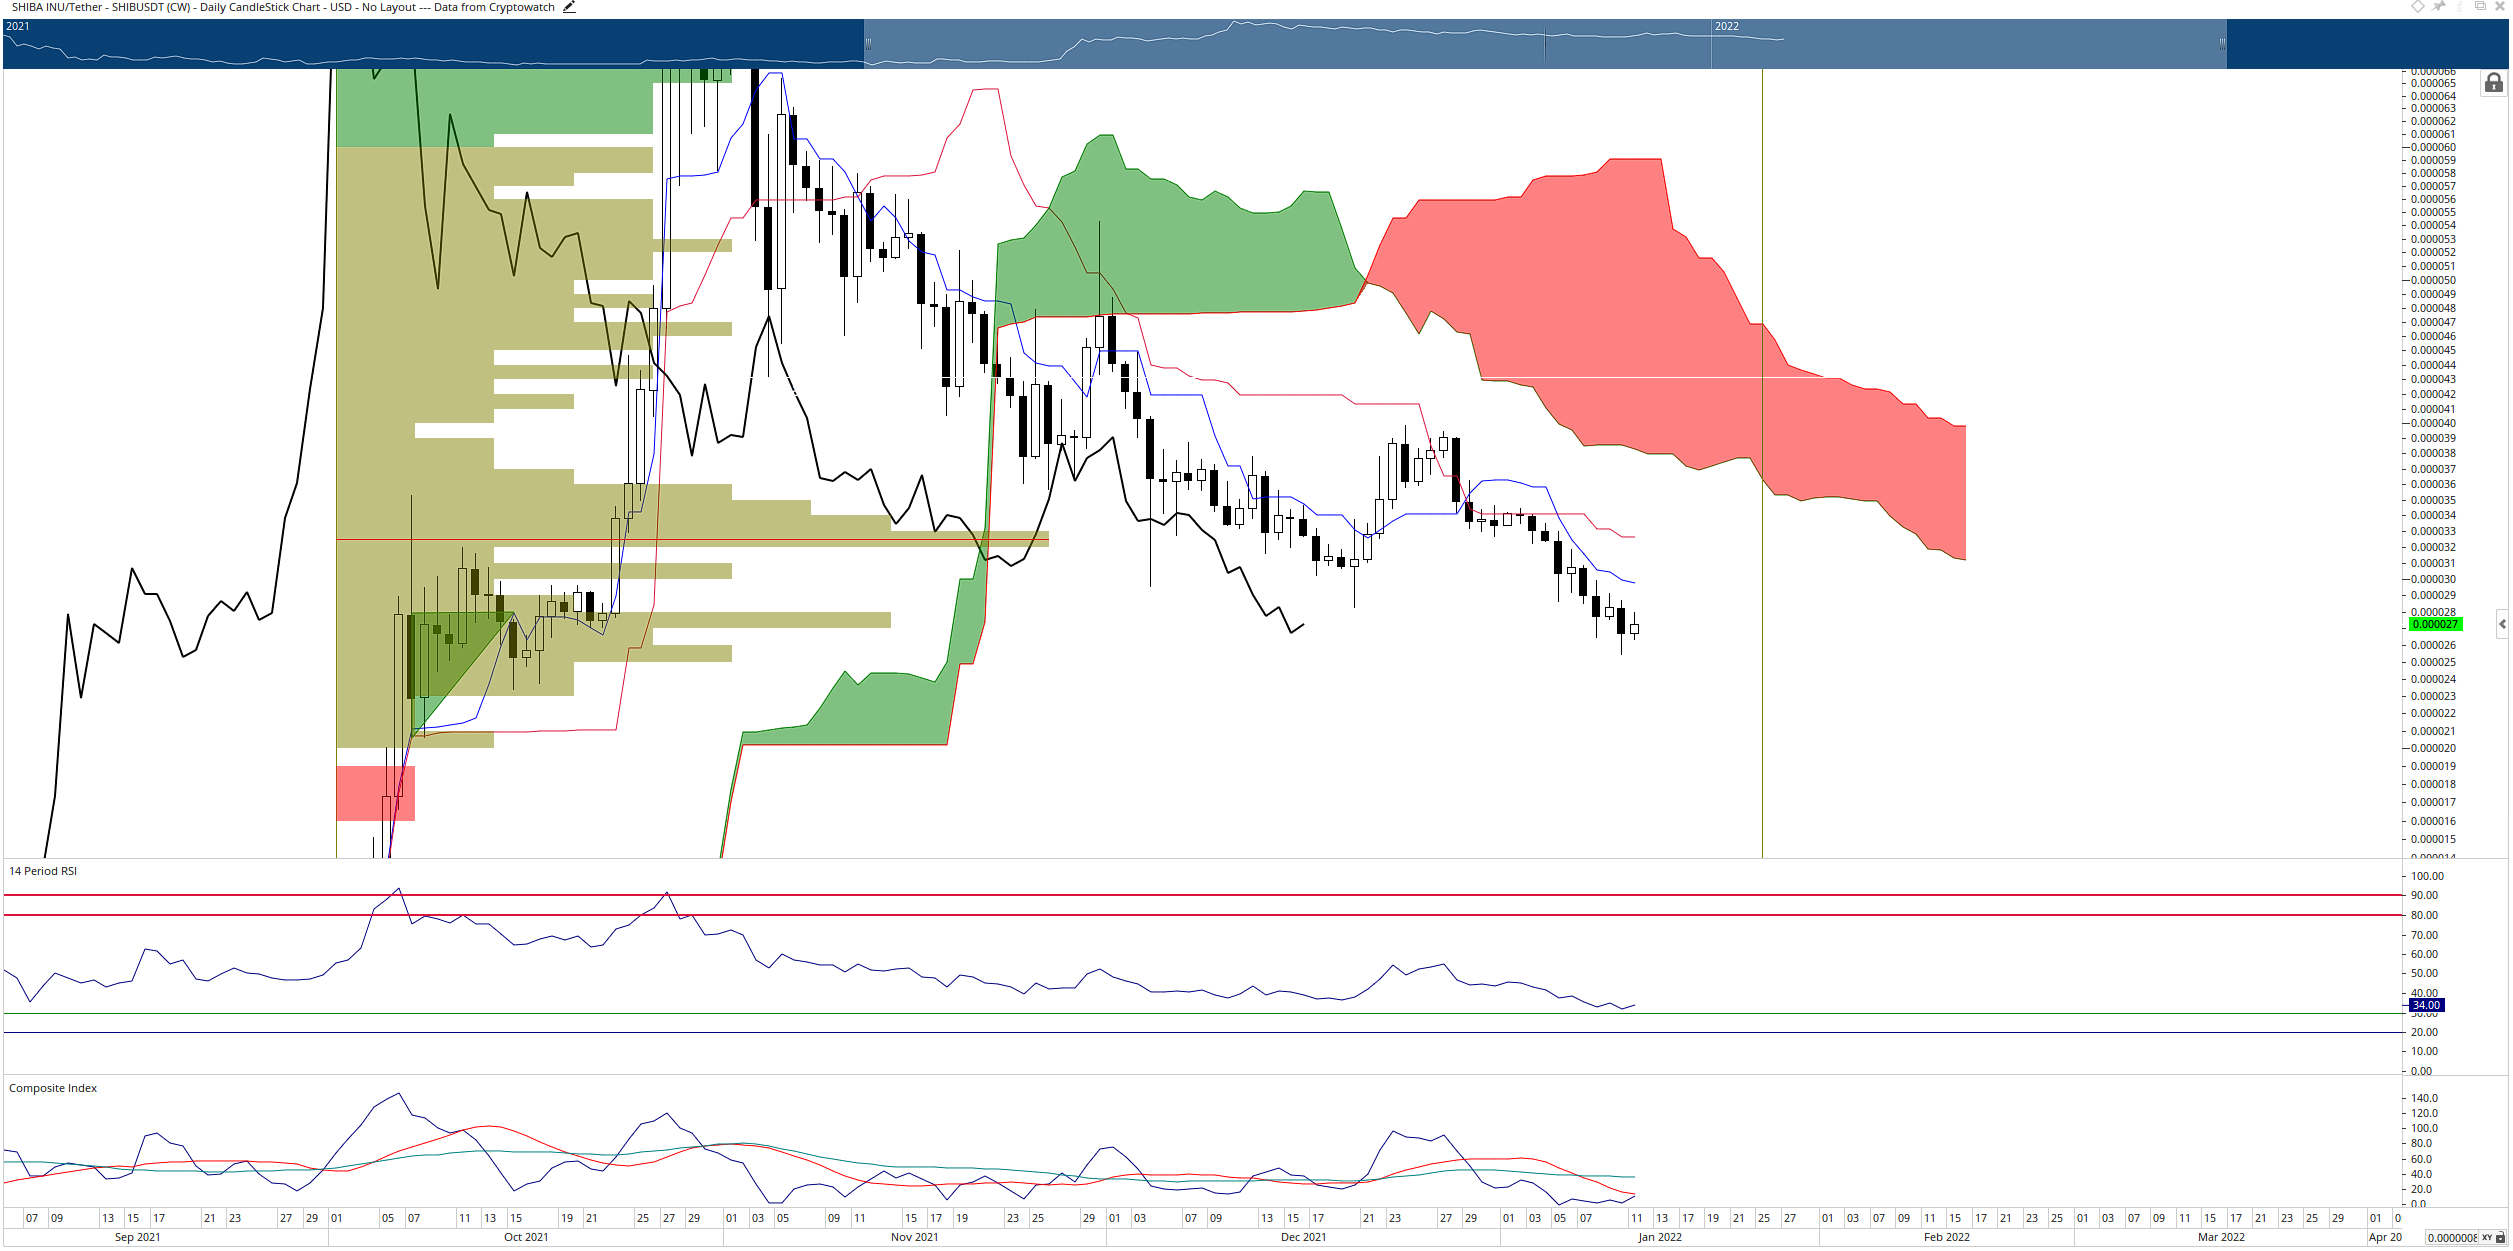
SHIBA/USDT Daily Ichimoku Chart
The oscillator levels do little to support any price action on the daily Ichimoku chart, but they support the bullish reversal structure present on the Point and Figure chart.
There is a falling wedge pattern on Shiba Inu’s Point and Figure chart. Previously, an entry was identified on the three-box reversal off of the prior O-column, but the sell-off in Bitcoin and Ethereum pushed Shiba Inu price into a non-organic swing low, invalidating the prior trade setup.
A new hypothetical long setup exists with a buy stop order at $0.0000350, a stop loss at $0.0000250, and a profit target at $0.0000775. The trade idea represents a 4.25:1 reward/risk with an implied profit target of 121% from the entry. A three-box trailing stop would protect any implied profits post entry.
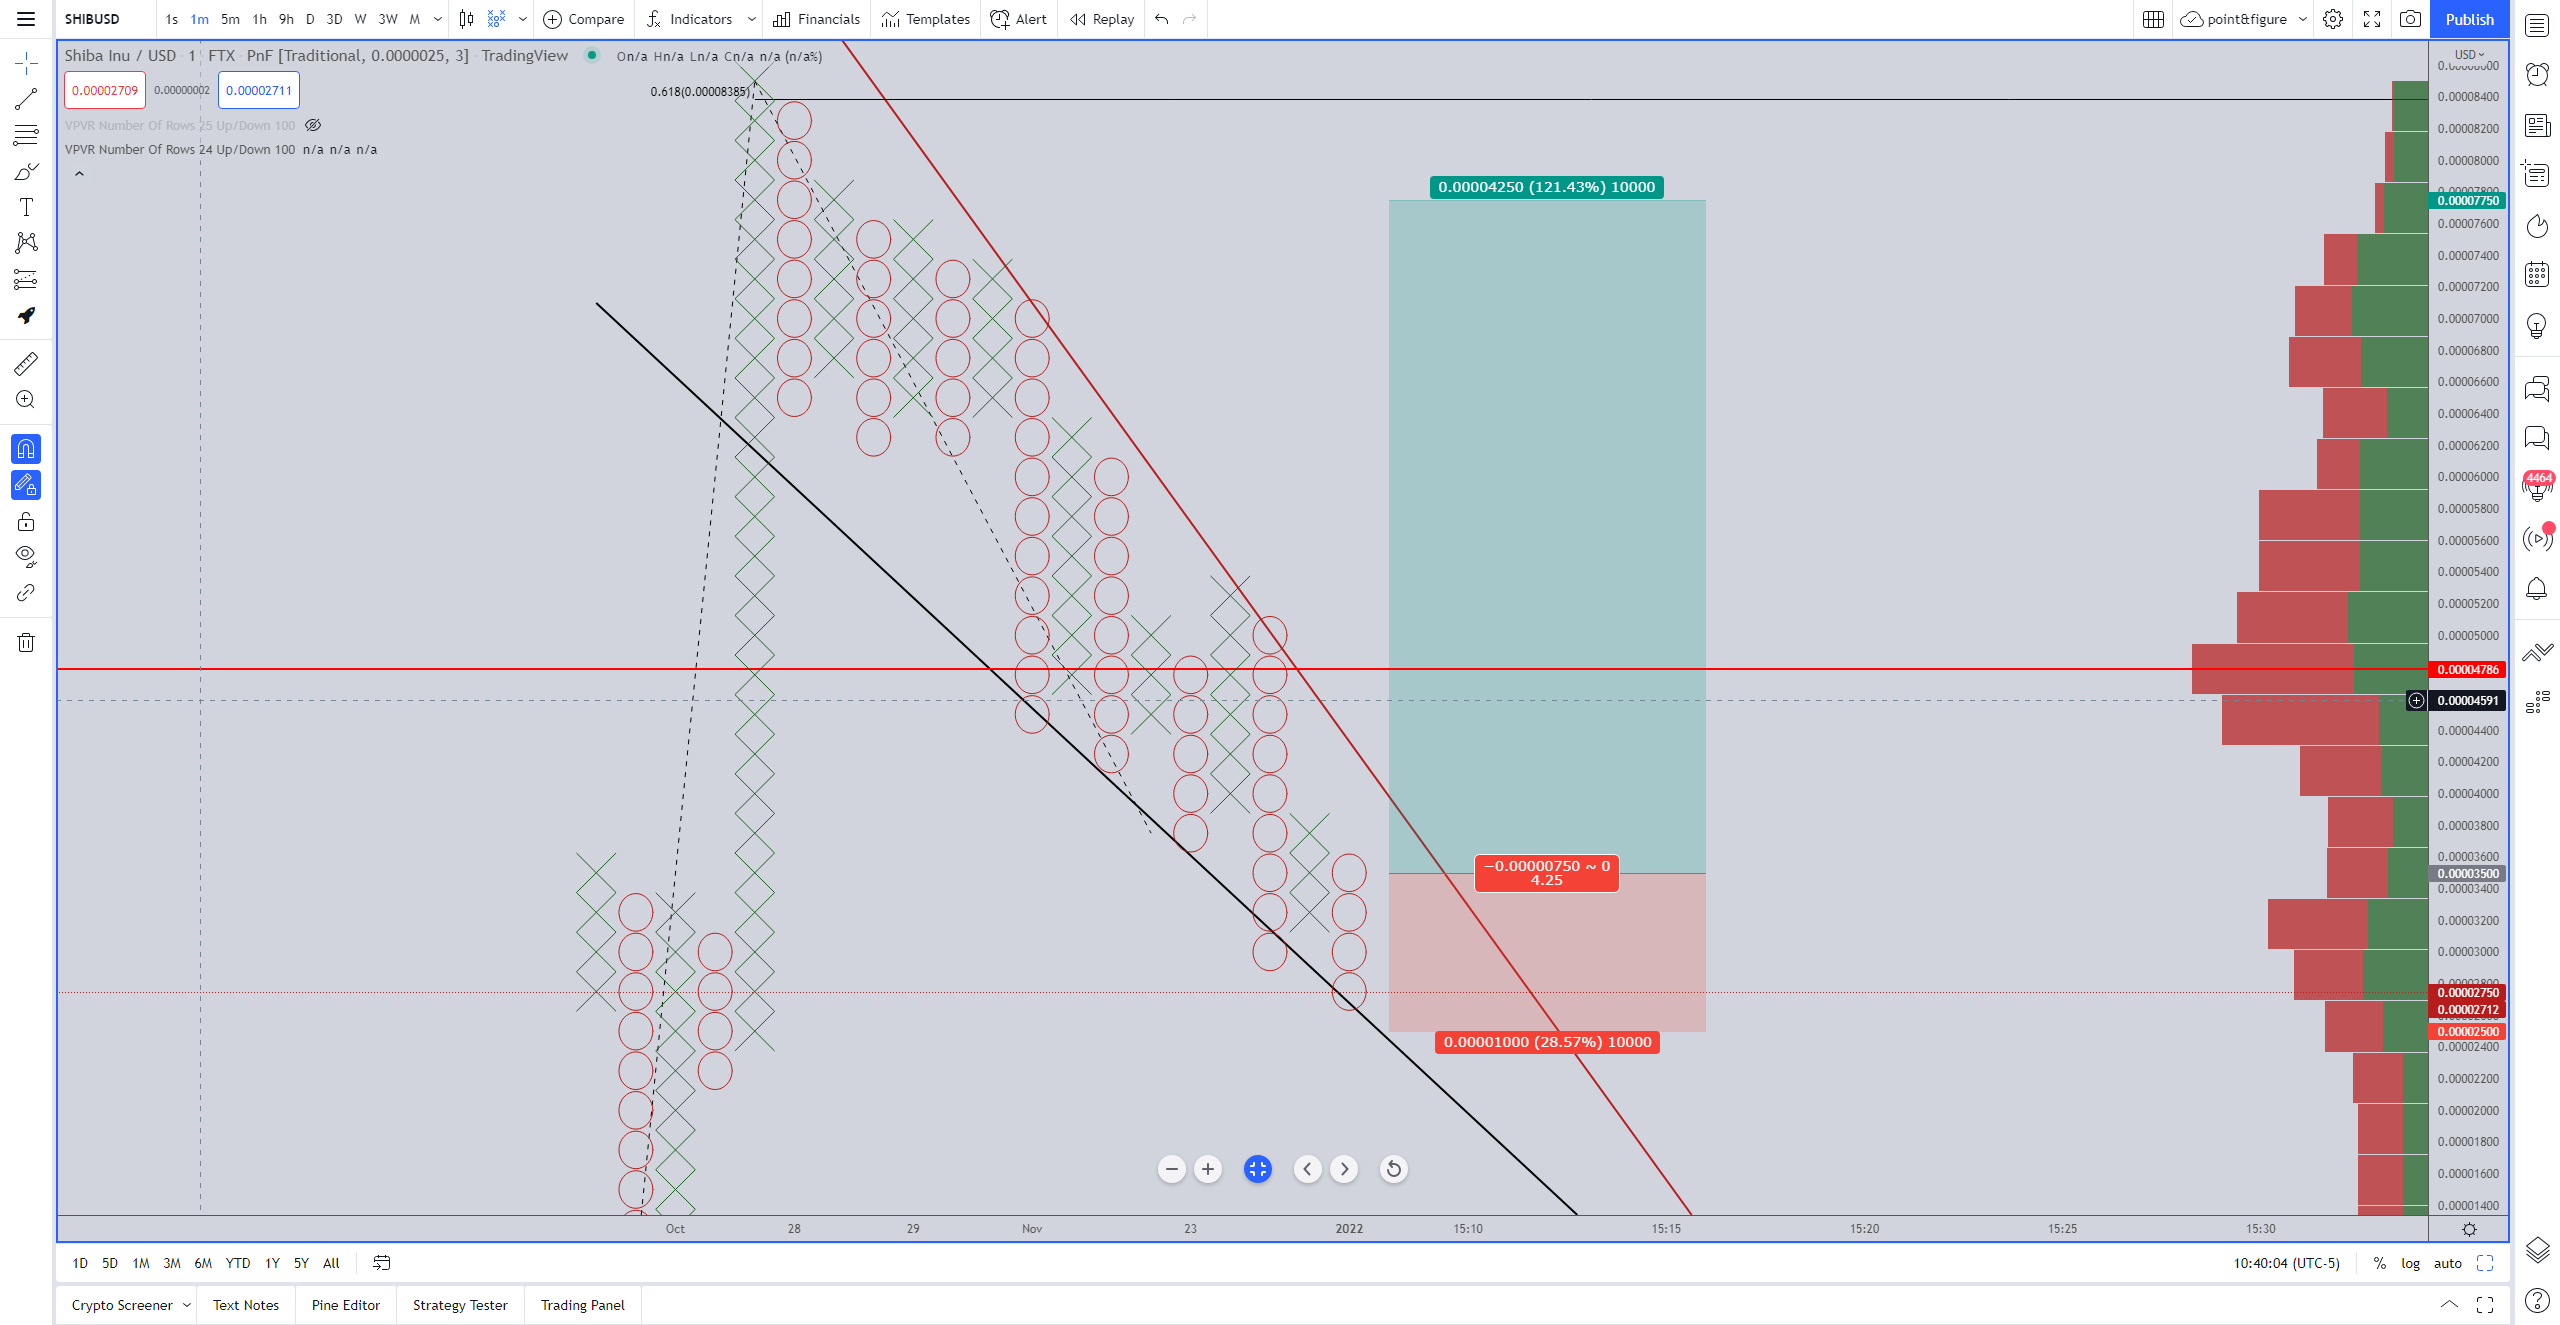
SHIBA/USDT $0.0000025/3-box Reversal Point and Figure Chart
The hypothetical long entry is invalidated if Shiba Inu price creates a close below the $0.0000200 value area.
Author

Jonathan Morgan
Independent Analyst
Jonathan has been working as an Independent future, forex, and cryptocurrency trader and analyst for 8 years. He also has been writing for the past 5 years.



