Top 3 Price Prediction Bitcoin, Ethereum, Ripple: Bitcoin eyes for $60,000
- Bitcoin price retests and bounces off from the daily support level of $56,000, eyeing a rally ahead.
- Ethereum price approaches the $2,400 resistance level; a close above signals a bullish move.
- Ripple breaks above the key resistance level around $0.544, impending rally is on the horizon.

Bitcoin (BTC) and Ripple (XRP) broke above their key resistance levels, hinting at a rally ahead. While Ethereum’s (ETH) price is nearing its key resistance level, a breakout could suggest a bullish move ahead.
Bitcoin price shows potential for upleg after finding support around $56,000
Bitcoin price retested the daily support level around $56,000 on Wednesday and bounced 3.7%. At the time of writing on Friday, it trades at around $58,000.
If the $56,000 daily support continues to hold, BTC could rise to $59,529, its 50% price retracement level (drawn from a high in late July to a low in early August).
The Moving Average Convergence Divergence (MACD) indicator further supports Bitcoin’s rise, which signals a bullish crossover on the daily chart. The MACD line (12-day Exponential Moving Average, blue line) moved above the signal line (26-day Exponential Moving Average, yellow line), giving a buy signal. It shows green histogram bars above the neutral line zero, also suggesting that Bitcoin’s price could experience upward momentum.
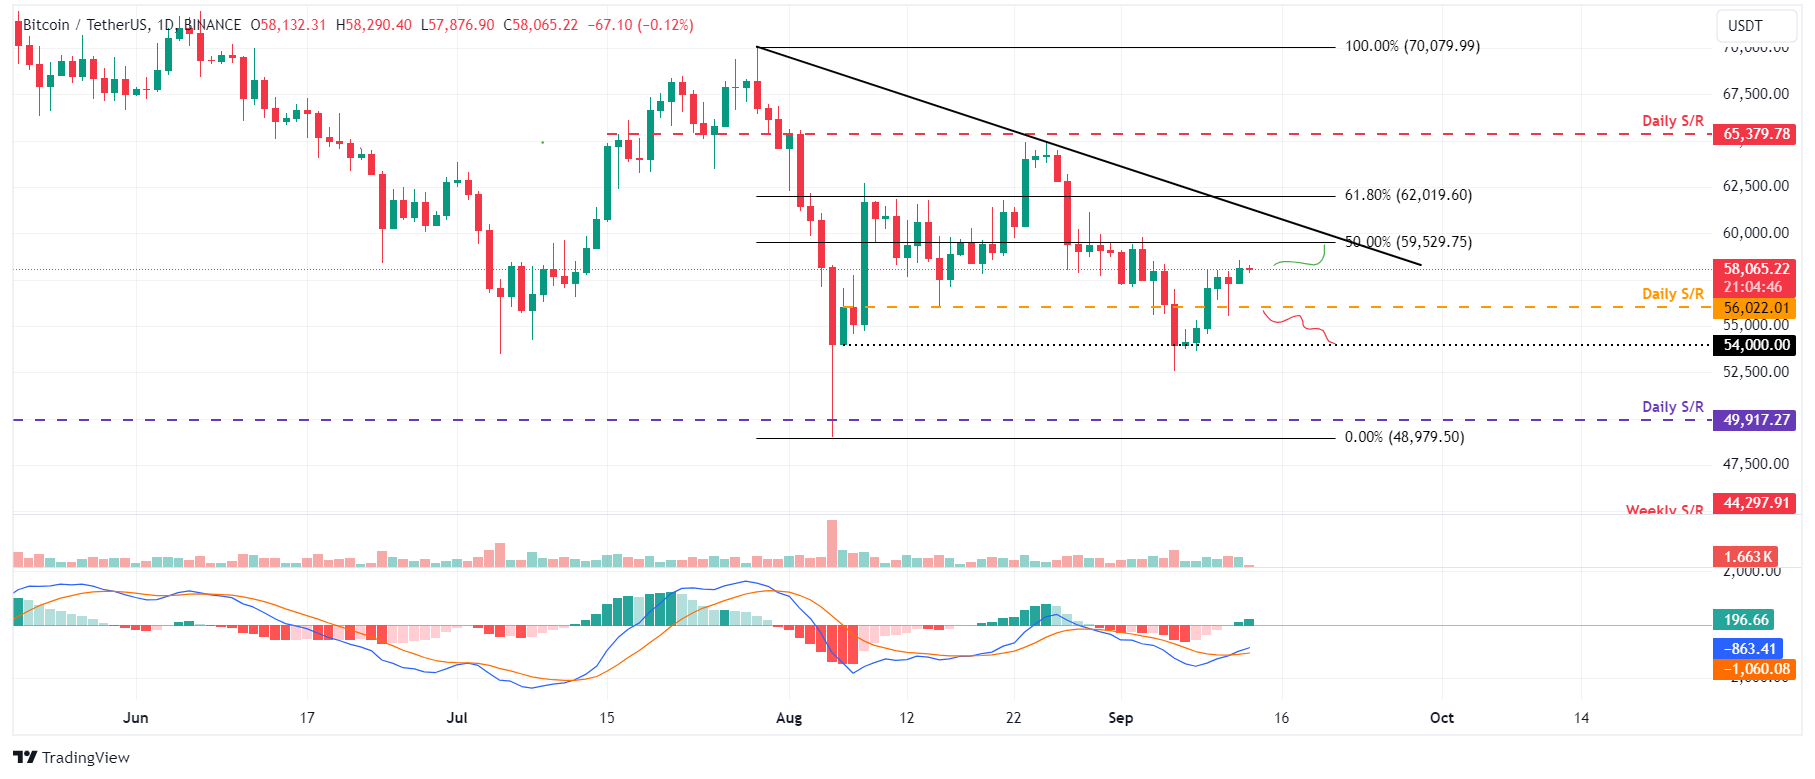
BTC/USDT daily chart
However, the bullish thesis would be invalidated if Bitcoin’s daily candlestick closes below $56,000. This scenario would lead to a decline of 3.5% to retest its psychologically important level at $54,000.
Ethereum price is poised for an upward moment if it closes above $2,400
Ethereum price recovered and is approaching its daily resistance level at $2,421. It trades at around $2,357 on Friday. If ETH breaks and closes above the $2,421 level, it could rally 6% to retest its 61.8% Fibonacci retracement level at $2,564 (drawn from a high in late August to a low in early September).
Additionally, the MACD indicator supports Ethereum’s price rise, signaling a bullish crossover. The MACD line (12-day EMA) rose above the signal line (26-day EMA), giving a buy signal. It also shows green histogram bars above the neutral line zero, suggesting upward momentum.
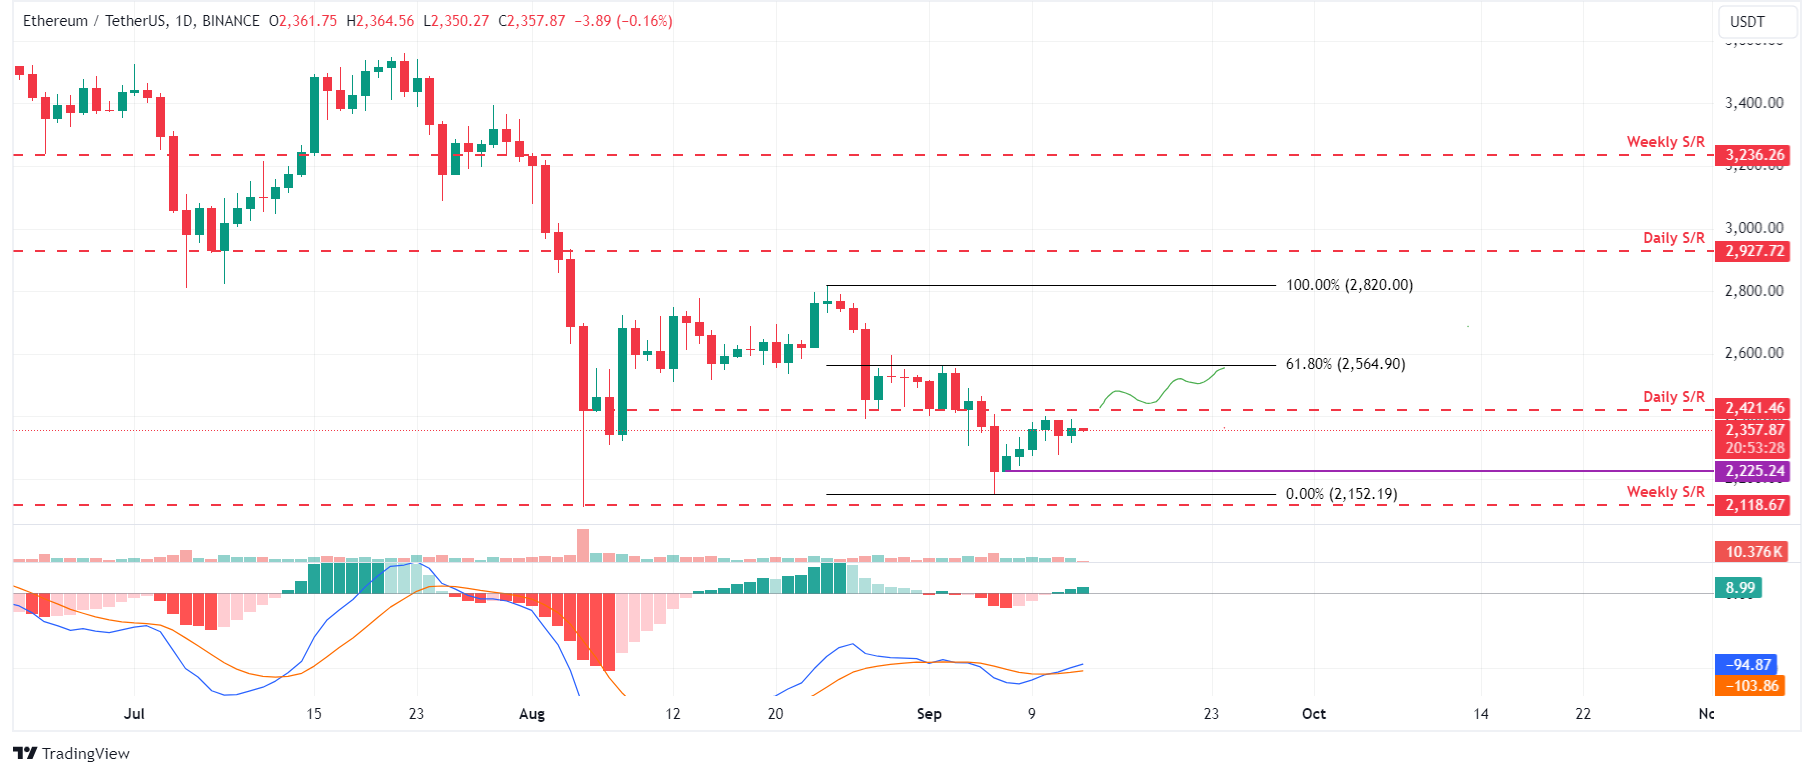
ETH/USDT daily chart
However, the bullish thesis would be invalidated if Ethereum fails to break above $2,421. This scenario would lead to an 8% decline to retest the September 7 low of $2,225.
Ripple is set for a rise as it breaks above its resistance barrier
Ripple price broke above daily support at $0.544 and the 200-day EMA at $0.548 on Thursday, rising 5%. As of Friday, it trades around the $0.558 level.
If the $0.544 level holds as support, XRP could rally 11.5% from its current trading level to retest its daily resistance level at $0.626.
This bullish outlook is further supported by the MACD indicator, which signals a bullish crossover. The MACD line is above the signal line, giving a buy signal. It also shows green histogram bars above the neutral line zero, suggesting upward momentum.
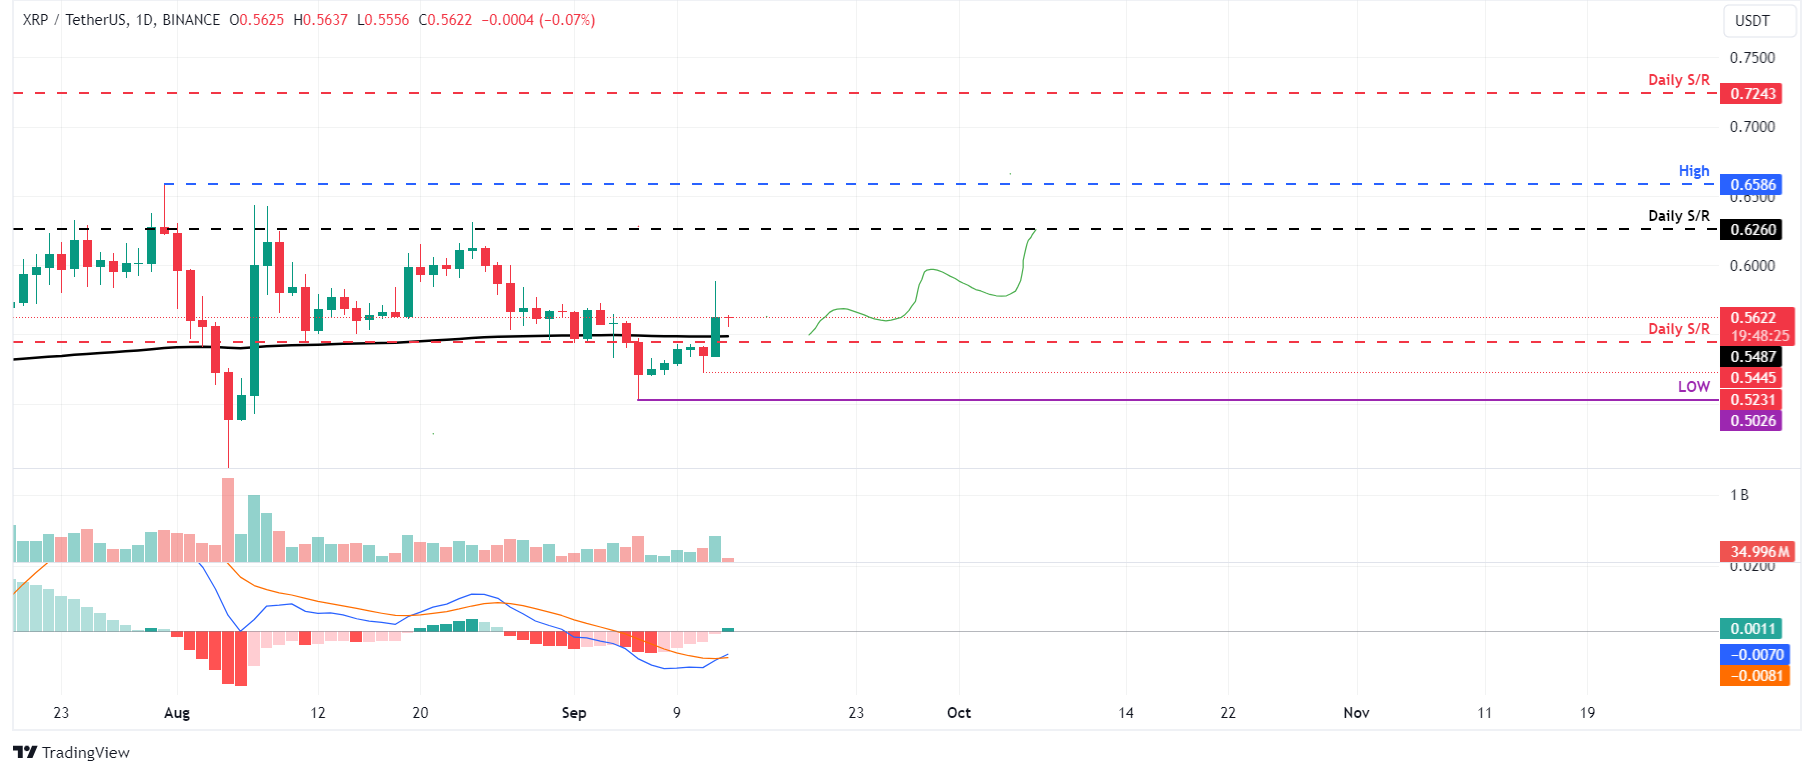
XRP/USDT daily chart
On the other hand, if Ripple’s price closes below the $0.544 level, the bullish thesis would be invalidated. In this case, it could decline 7.6% to retest its September 6 low of $0.520.
Author

Manish Chhetri
FXStreet
Manish Chhetri is a crypto specialist with over four years of experience in the cryptocurrency industry.


