|

Dogecoin Elliott Wave technical analysis [Video]

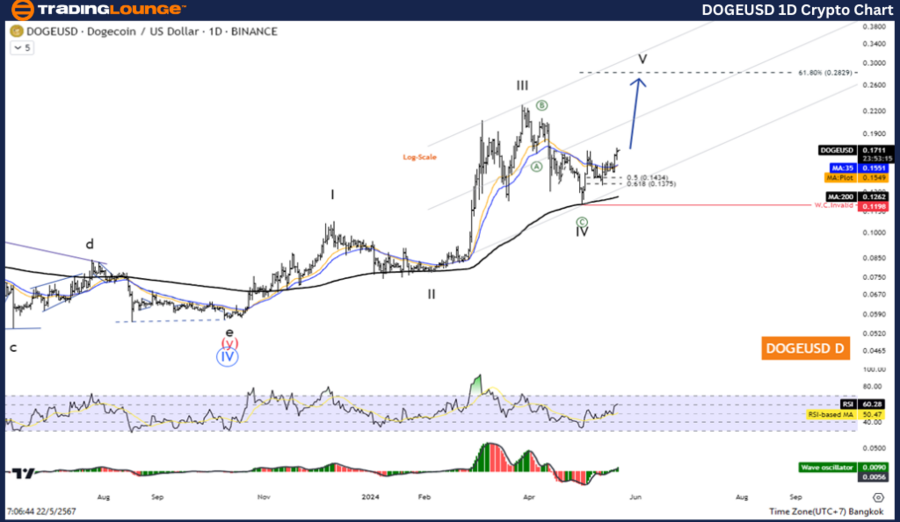
Elliott Wave Analysis TradingLounge Daily Chart

Dogecoin/ U.S. dollar(DOGEUSD)

DOGE/USD Elliott Wave technical analysis 

Function: Counter trend.

Mode: Corrective.

Structure: Zigzag.

Position: Wave ((C)).

Direction next higher degrees: Wave I of Impulse.

Details: Wave (4) may is complete and the Price entry to uptrend again.

Dogecoin/ U.S. dollar (DOGEUSD) Trading Strategy: Overall, Dogecoin remains in an uptrend. Moreover, it looks like the correction is over. And prices are rising again in the fifth wave. But there may be a slight pullback before increasing. So look for opportunities to join the uptrend.

Dogecoin/ U.S. dollar(DOGEUSD)Technical Indicators: The price is above the MA200 indicating an Uptrend, The Wave Oscillator is a Bullish Momentum.
Doge

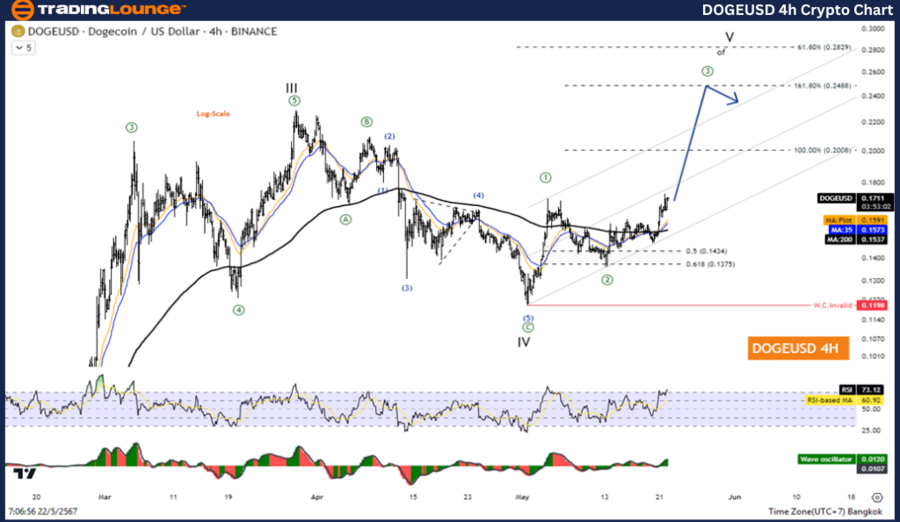
DOGE/USD Elliott Wave four-hour chart

Function: Counter trend.    

Mode: Corrective.

Structure: Zigzag.

Position: Wave ((C)).

Direction next higher degrees: Wave I of Impulse.

Details: Wave (4) may is complete and the Price entry to uptrend again.

Dogecoin/ U.S. dollar(DOGEUSD)Trading Strategy: Overall, Dogecoin remains in an uptrend. Moreover, it looks like the correction is over. And prices are rising again in the fifth wave. But there may be a slight pullback before increasing. So look for opportunities to join the uptrend.

Dogecoin/ U.S. dollar(DOGEUSD)Technical Indicators: The price is above the MA200 indicating an Uptrend, The Wave Oscillator is a Bullish Momentum.
Doge

Dogecoin Elliott Wave technical analysis [Video]

Author

Peter Mathers

Peter Mathers

TradingLounge

Peter Mathers started actively trading in 1982. He began his career at Hoei and Shoin, a Japanese futures trading company.


More from Peter Mathers
Share:

Editor's Picks

Top 3 Price Prediction: BTC, ETH and XRP retreat as Fed rate decision looms

Bitcoin, Ethereum and Ripple remain under pressure and consolidate at the time of writing on Wednesday after falling more than 3%, 4% and 9%, respectively, as the Clarity Act failed to advance in the Senate on Tuesday.

Crypto Overview: Bitcoin falls to $75,000 as CLARITY Act fails to advance – Pi Network, Injective lead losses
Bitcoin (BTC) price trades around $75,000 on Wednesday, following a 3% decline the previous day as the US Senate failed to advance the CLARITY Act to a cloture vote. The broader cryptocurrency market's risk-on sentiment eases, with over $600 million in liquidations in 24 hours, driven primarily by long-position unwinding.
CLARITY fails to pass Senate, what happens next?
The US Senate on Tuesday blocked further consideration of the Digital Asset Market Clarity Act, with a procedural vote falling short of the 60 required YEA. The motion to advance the bill failed 49-50, with all 49 supporting votes coming from Republicans. The setback leaves the market-structure bill stalled as Congress moves closer to its midterm election recess.
Ethereum Price Forecast: ETH continues to attract capital despite impending rate hike and Clarity Act failure
Ethereum (ETH) declined to $2,400 on Tuesday after the Clarity Act failed to progress in the Senate. Despite that and the market's near certainty of an interest rate hike at the next Federal Reserve (Fed) meeting, the top altcoin has continued to attract fresh capital. Ethereum buyers have been dominating sellers over the past few days.
Bitcoin: BTC retreats as macro headwinds grow
Bitcoin (BTC) remains under pressure, down over 4% this week and trading around $76,900 at the time of writing on Friday. Institutional demand shows signs of weakness as spot BTC Exchange Traded Funds (ETFs) are on track to end their three-week inflow streak, recording nearly $500 million in net outflows through Thursday.

