Dogecoin downside risk could be significant, if support fails DOGE could hit $0.08
- Dogecoin price remains just a hair above a central capitulation zone.
- If buyers don’t step in, then DOGE could have a dramatic fall into single digits.
- Bulls and bears are apprehensive, given the current trading behavior.

Dogecoin price action has been at a make-or-break trading range for over a month. However, flash-crash south is up ahead if bulls cannot support Dogecoin over the next two weeks.
Dogecoin price faces a 44% loss if near-term support fails
Dogecoin price is close to a significant drop. The red shaded zone on the chart below identifies a price range where the Volume Profile becomes extremely thin between the $0.08 and $0.16 value areas. Understanding how Volume Profile is interpreted can help shed light on how close Dogecoin is to a significant capitulation move.
The Volume Profile is the horizontal measurement of volume at a particular price. It identifies price levels where the most buying and selling has occurred – where bulls and bears have battled the most to determine market direction. Levels that stick out and are longer than the majority of the Volume Profile are called High Volume Nodes.
High Volume Nodes represent critical levels of support and resistance. Therefore, in technical analysis, analysts interpret the movement away from high-volume nodes as an event of critical importance. This is especially true if there is a wide-open space between one high-volume node and the next.
The expected behavior that Dogecoin price would experience if there were a daily close between $0.15 to $0.16 would be a swift move south. Empty areas in a volume profile act as a kind of vacuum and ‘suck’ and price to the next high volume node. For Dogecoin, that would mean a return to the $0.08 value area.
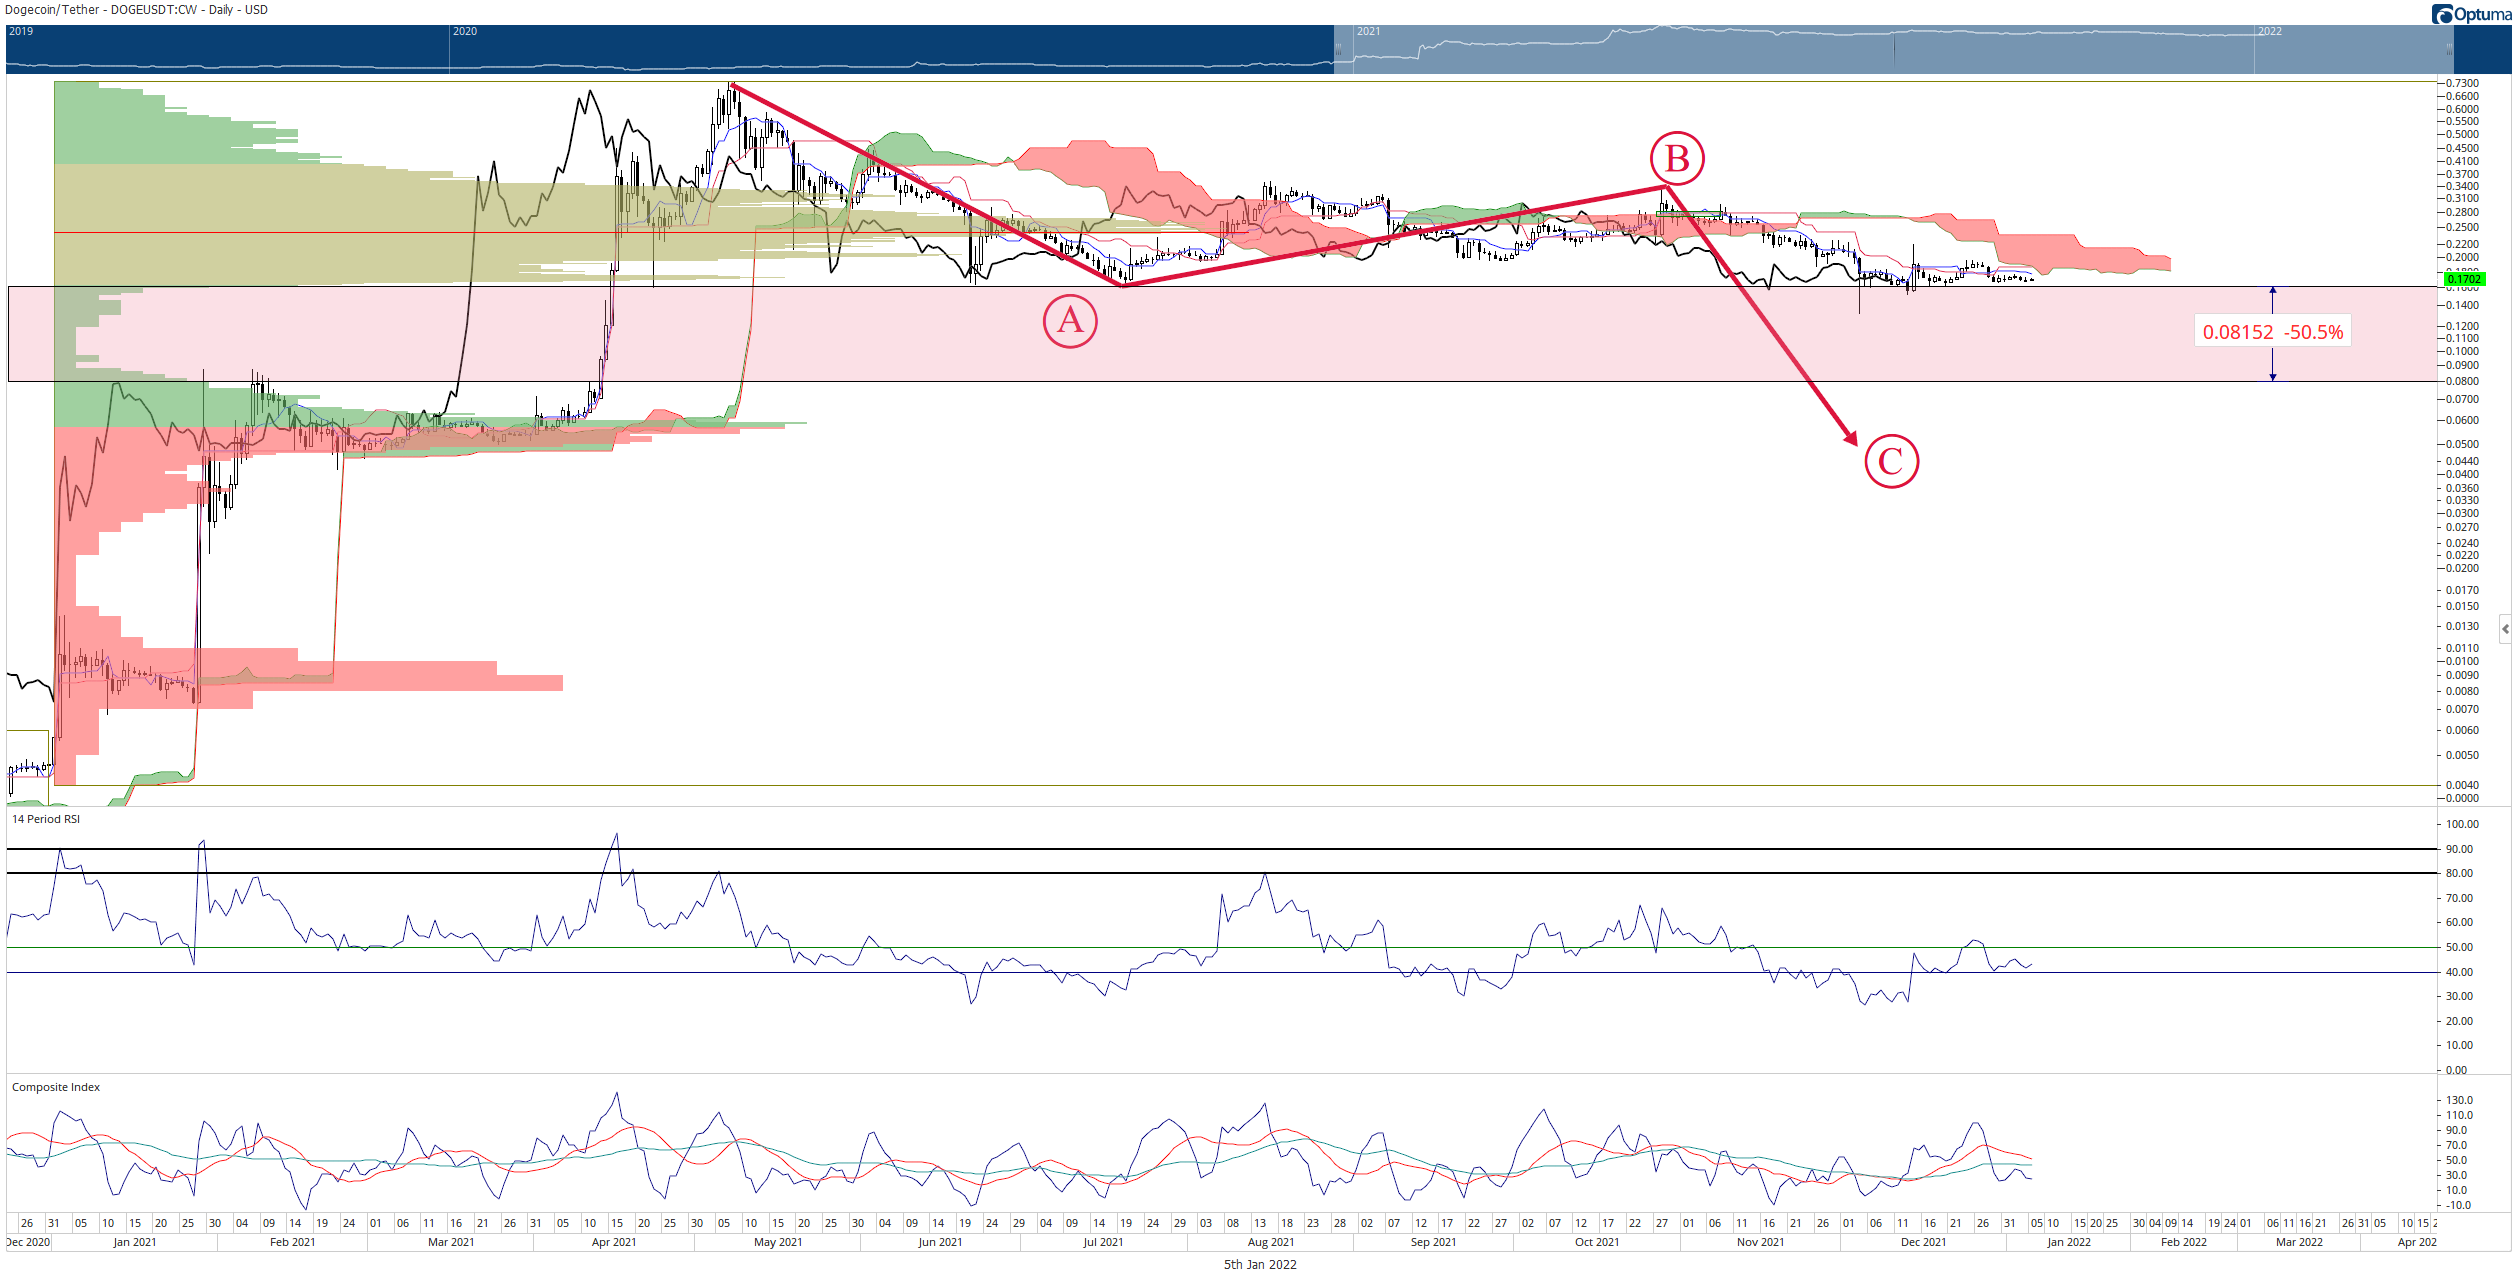
DOGE/USDT Daily Ichimoku Chart
However, bears have been given multiple opportunities over the past month to push Dogecoin price into a significant collapse – but have been unable or unwilling to do so. Hodlers have not capitulated yet; bears are anxious about opening a new short near these lows, and bulls on the sideline are nervous about buying a dip that could dip even more.
If Dogecoin price moves to a daily close above the Kijun-Sen and Tenkan-Sen at $0.19, buyers will likely pour into Dogecoin and begin a rally towards the $0.25 value area.
Author

Jonathan Morgan
Independent Analyst
Jonathan has been working as an Independent future, forex, and cryptocurrency trader and analyst for 8 years. He also has been writing for the past 5 years.



