Dog-based meme coins DOGE and SHIB dip as bearish bets increase among traders
- Dogecoin price continued to decline on Monday after correcting more than 6% the previous week.
- Shiba Inu price trades in the red on Monday after declining almost 7% last week.
- DOGE and SHIB long-to-short ratio trades are below one, indicating more traders are betting for dog-based meme coins to fall.

Dogecoin (DOGE) and Shiba Inu (SHIB) prices continue to decline on Monday after correcting more than 6% in the previous week. DOGE and SHIB long-to-short ratio trades are below one, indicating more traders are betting for dog-based meme coins to fall.
Dog-themed memecoins face downlegs as bearish bets increase among traders
According to Coinglass’s data, the long-to-short ratio of dog-themed memecoins DOGE and SHIB reads 0.79 and 0.82, respectively. This ratio below one reflects bearish sentiment in the markets as more traders are betting for the memecoins to fall.
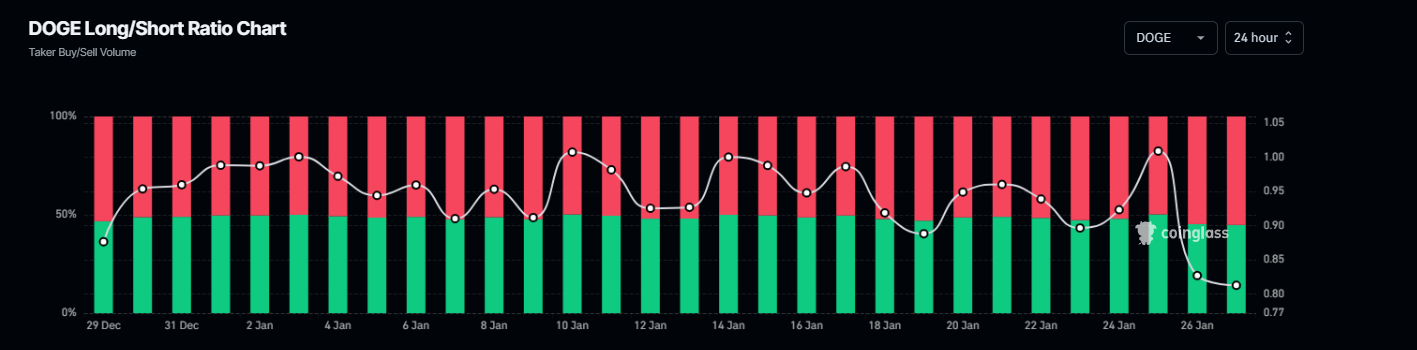
DOGE long-to-short ratio chart. Source: Coinglass
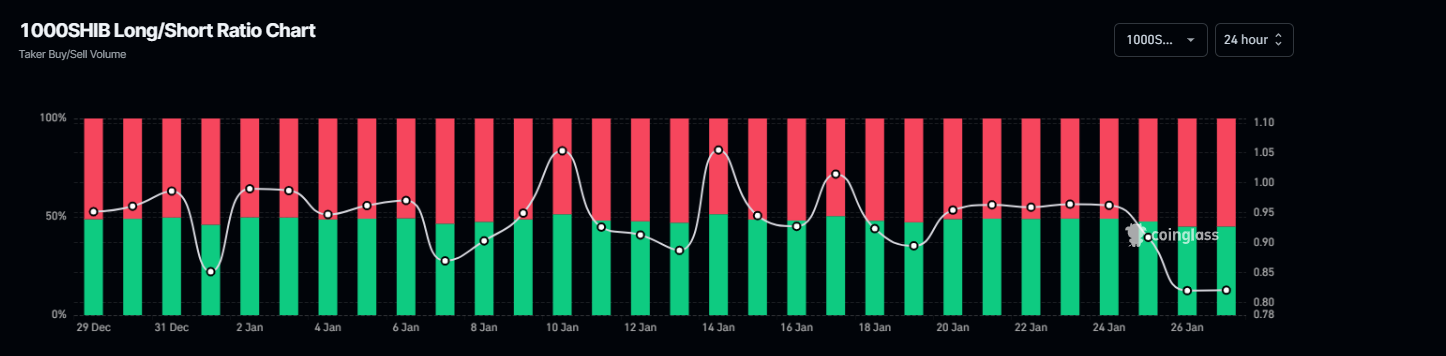
SHIB long-to-short ratio chart. Source: Coinglass
Dogecoin Price Forecast: DOGE shows signs of weakness
Dogecoin price faced rejection around its 61.8% Fibonacci retracement level on January 21 (drawn from the December 8 high of $0.48 to the December 20 low of $0.26) at $0.40, which declined 16.78% until Sunday. At the time of writing on Monday, it continues to trade down around $0.32.
If DOGE continues its correction, it could extend its decline to retest its December 20 low of $0.26.
The Relative Strength Index (RSI) indicator on the daily chart reads 40, below its neutral level of 50, pointing downwards, indicating bearish momentum. The Moving Average Convergence Divergence (MACD) indicator also shows a bearish crossover on Thursday, indicating a downward trend.
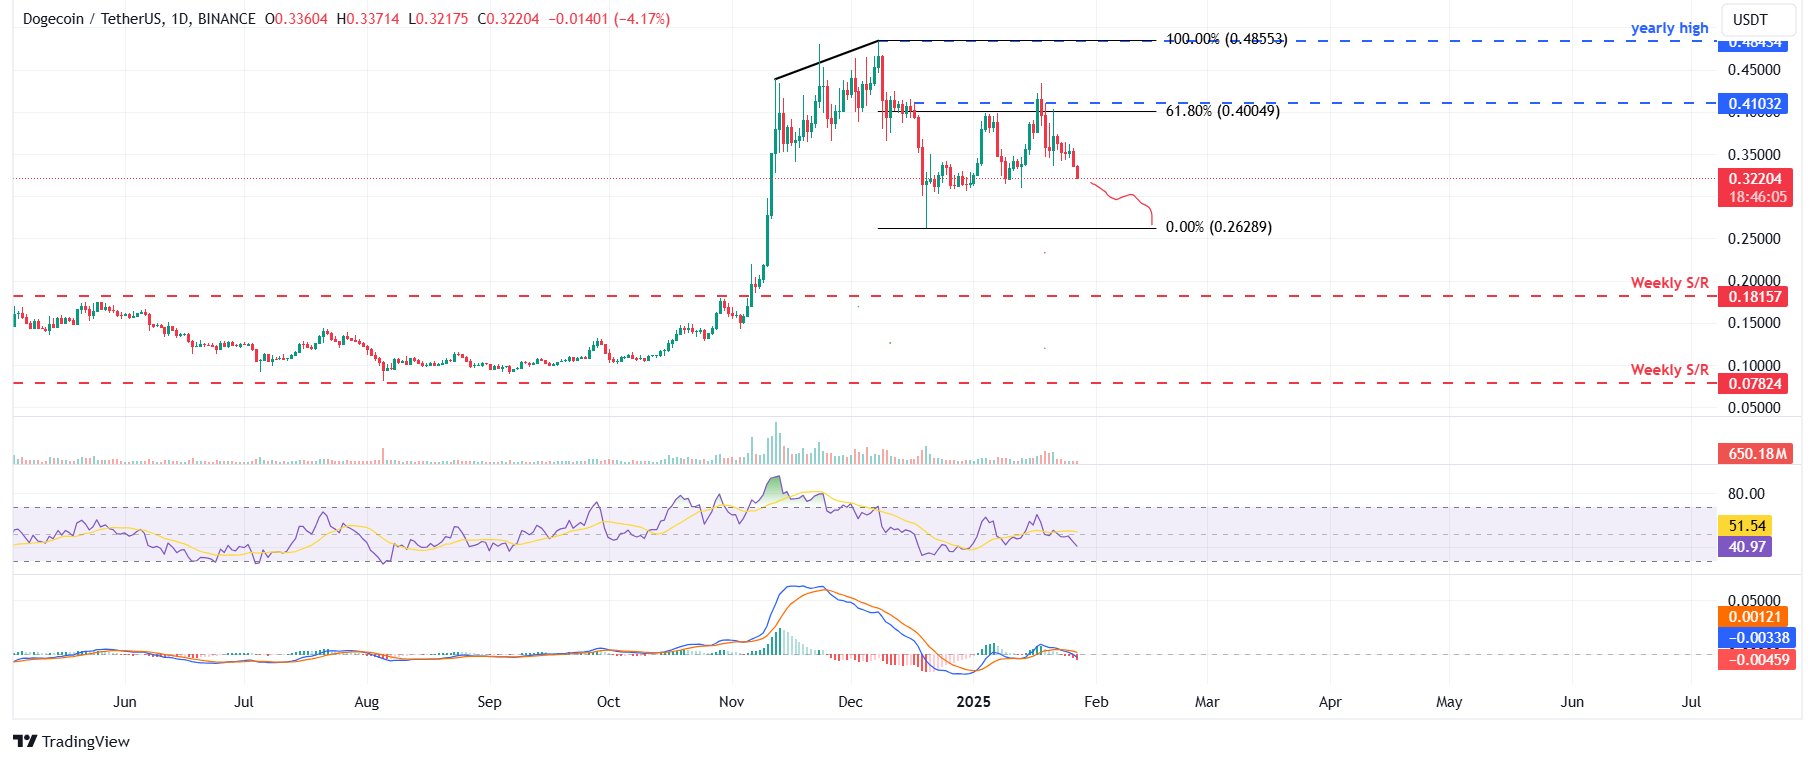
DOGE/USDT daily chart
Shiba Inu Price Forecast: Poised for a double-digit crash
Shiba Inu price broke and closed below its ascending trend (drawn from connecting multiple low levels since August 5) on Friday and declined 4.36% until Sunday. At the time of writing on Monday, it continues to trade down around $0.000018.
If SHIB continues its pullback, it could extend its decline by 12% to retest its November 3 low of $0.000016.
The RSI indicator on the daily chart reads 34, below its neutral level of 50, pointing downwards, indicating bearish momentum. The MACD indicator also shows a bearish crossover on January 20, indicating a downward trend.
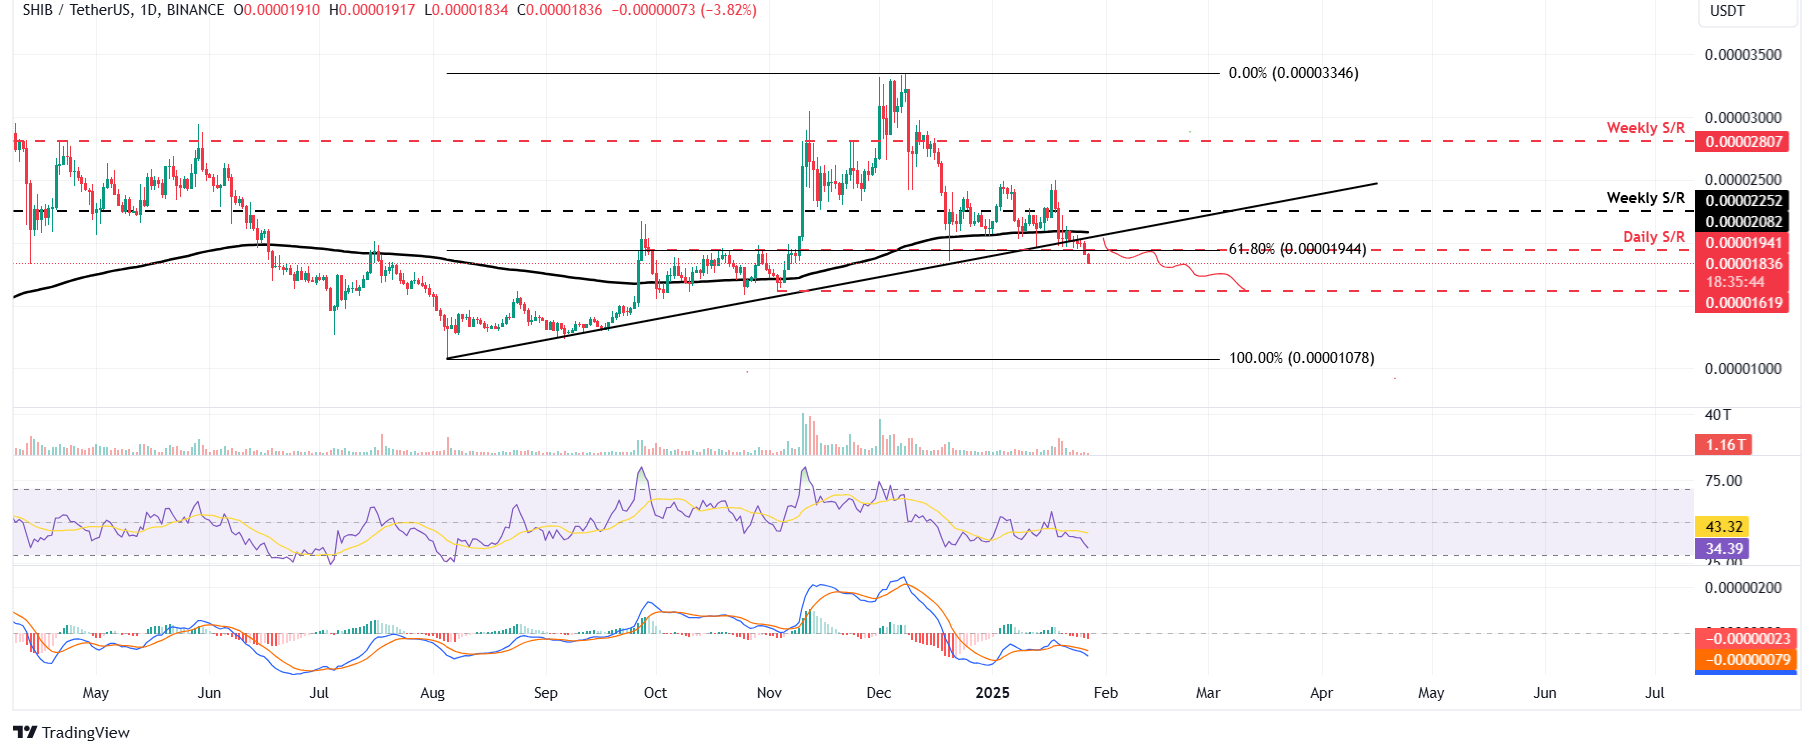
SHIB/USDT daily chartRelated news
Author

Manish Chhetri
FXStreet
Manish Chhetri is a crypto specialist with over four years of experience in the cryptocurrency industry.


