Solana signals bullish breakout as Huma Finance 2.0 launches on the network
- Solana retests falling wedge pattern resistance as a 30% breakout looms.
- Huma Finance 2.0 joins the Solana DeFi ecosystem, allowing access to stable, real yield.
- A neutral RSI and macroeconomic uncertainty due to US President Donald Trump’s tariff policy could limit SOL’s rebound.

Solana (SOL), the fourth-largest smart contracts token, slightly retraces and trades at $114.46 at the time of writing on Thursday after gaining 8% in the last 24 hours. SOL surged to retest the $120.00 hurdle as global markets rebounded in celebration of United States (US) President Donald Trump’s decision to suspend reciprocal tariffs, which affected dozens of countries, on Wednesday. Meanwhile, Huma Finance 2.0, the first Payment Finance (PayFi) Network, debuted on the Solana blockchain, bringing stable, real yield to the decentralized finance (DeFi) ecosystem.
Huma Finance 2.0 live on Solana
Huma Finance 2.0, the network that powers the financing of global markets to achieve instant liquidity anywhere and anytime, has launched on the Solana blockchain.
Huma 2.0 is now LIVE. Only on @solana!
— Huma Finance 🟣 (@humafinance) April 10, 2025
🔥 REAL Yield is now open to everyone.
✅ Earn stable, double-digit yield, bull or bear
✅ Stack Huma Feathers up to 25x
✅ Plug into Solana DeFi w/ @JupiterExchange @MeteoraAG @KaminoFinance @RateX_Dex
Here’s what’s new👇 pic.twitter.com/EzALM8kwOw
The protocol brings the DeFi ecosystem a permissionless, regulatory-compliant, composable, and stable real yield. According to a blog post published on Wednesday, the system’s “double-digit yield is generated by real payment financing activities,” ensuring everyone can access previously reserved opportunities for institutional players.
“By making our product permissionless, we’ve now made real yield accessible to everyone, allowing anyone, anywhere to earn from the flow of real-life commerce,” Huma said in the blog post.
The platform prioritizes flexibility so users can choose different unique ways to earn. For instance, the classic mode provides participants with stable, double-digit real yield, while the maxi mode is built for Huma maxis. Huma Finance 2.0 supports optional lock-ups for more rewards. It has three partners, including Jupiter, Kamino and RateX.
Solana price flirts with falling wedge pattern breakout
Solana price failed to break the $120.00 resistance on Wednesday, subsequently delaying a potential falling wedge pattern breakout, which could boost SOL’s bullish momentum to $142.00. A falling wedge pattern is a bullish formation in a downtrend or consolidation phase, formed by drawing two downward-sloping trendlines that converge as the price makes lower highs and lower lows.
The pattern signals declining sell-side pressure, with a bullish breakout confirmed by the price breaking above the upper trendline. A 30% increase in price is anticipated in the daily chart to $142.00, equal to the distance between the pattern’s widest points extrapolated above the breakout point.
Following the breakout, Solana may face resistance at the 50-day Exponential Moving Average (EMA) at $138.02, the 100-day EMA at $157.50 and the 200-day EMA at $167.12. If SOL can break above these levels with high volume, it could confirm a longer-term bullish trend.
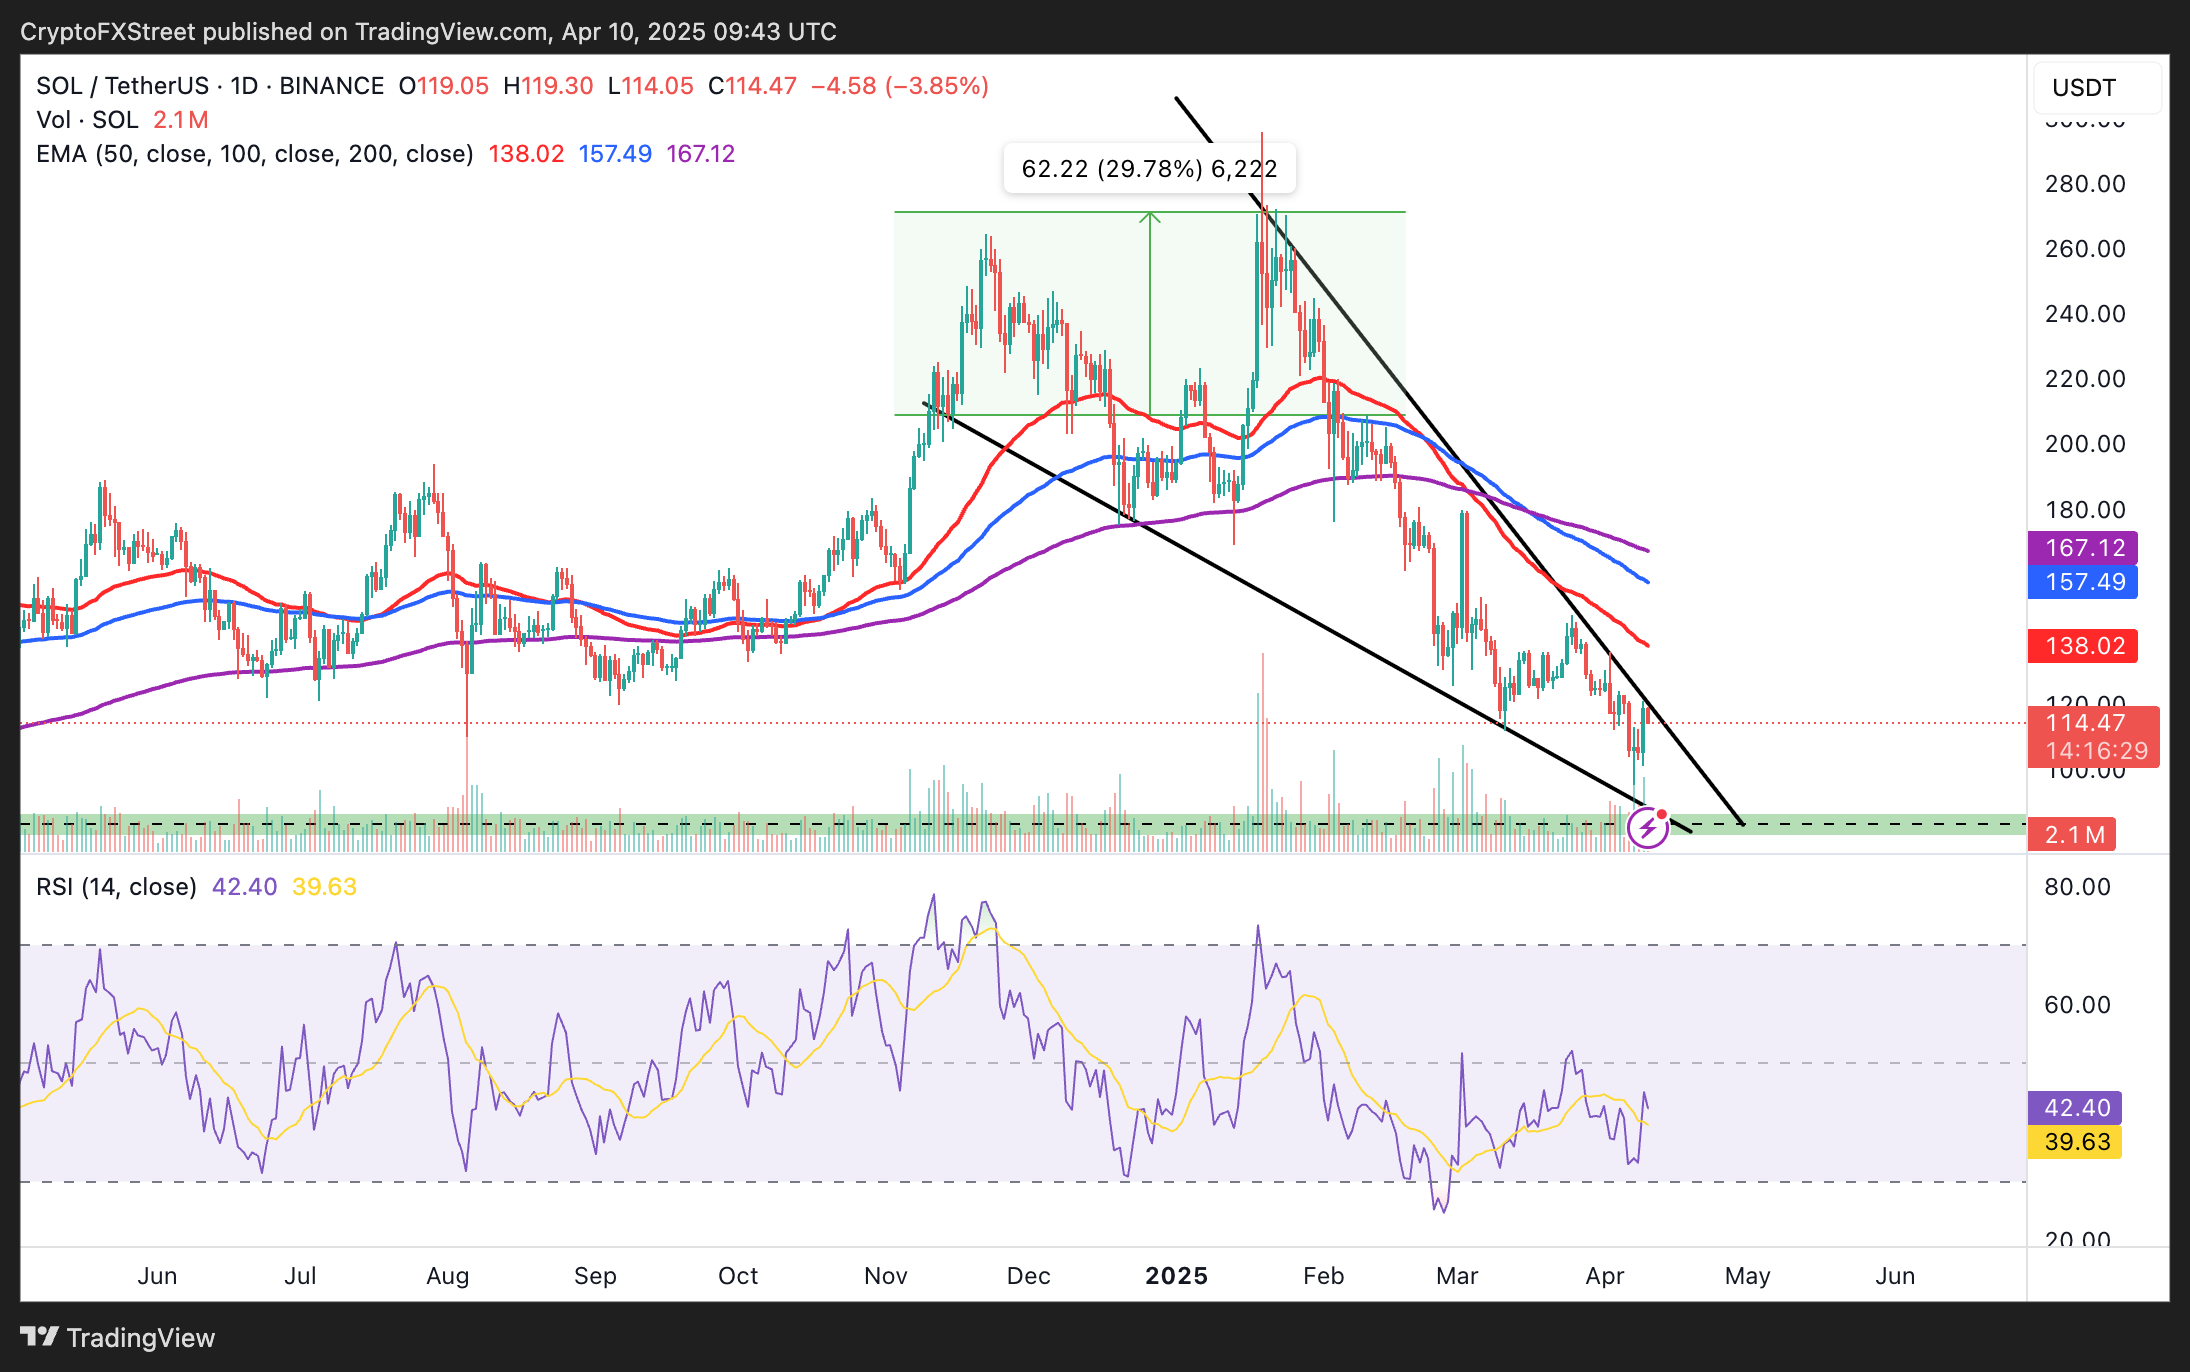
SOL/USD daily chart
The Relative Strength Index (RSI) at 42.55 indicates neutrality in Solana’s momentum and room for growth. Traders should watch for the RSI’s ascent above 50 to validate the bullish momentum in conjunction with the potential falling wedge pattern breakout.
However, traders must also consider the possibility of a false breakout. If volume fails to surge and the price falls back into the wedge pattern, Solana could extend the drawdown to support at $100, as tested on Monday. Moreover, despite a 90-day tariff pause in tariff implementation, investors are still in a risk-off mode, citing an uncertain economic future in the US.
Author

John Isige
FXStreet
John Isige is a seasoned cryptocurrency journalist and markets analyst committed to delivering high-quality, actionable insights tailored to traders, investors, and crypto enthusiasts. He enjoys deep dives into emerging Web3 tren


