Cryptocurrencies Price Prediction: Ripple, Bitcoin & ChainLink – European Wrap 26 April [Video]
![Cryptocurrencies Price Prediction: Ripple, Bitcoin & ChainLink – European Wrap 26 April [Video]](https://editorial.fxstreet.com/images/Markets/Currencies/Cryptocurrencies/Coins/Ripple/Ripple_Watch_XtraLarge.jpg)
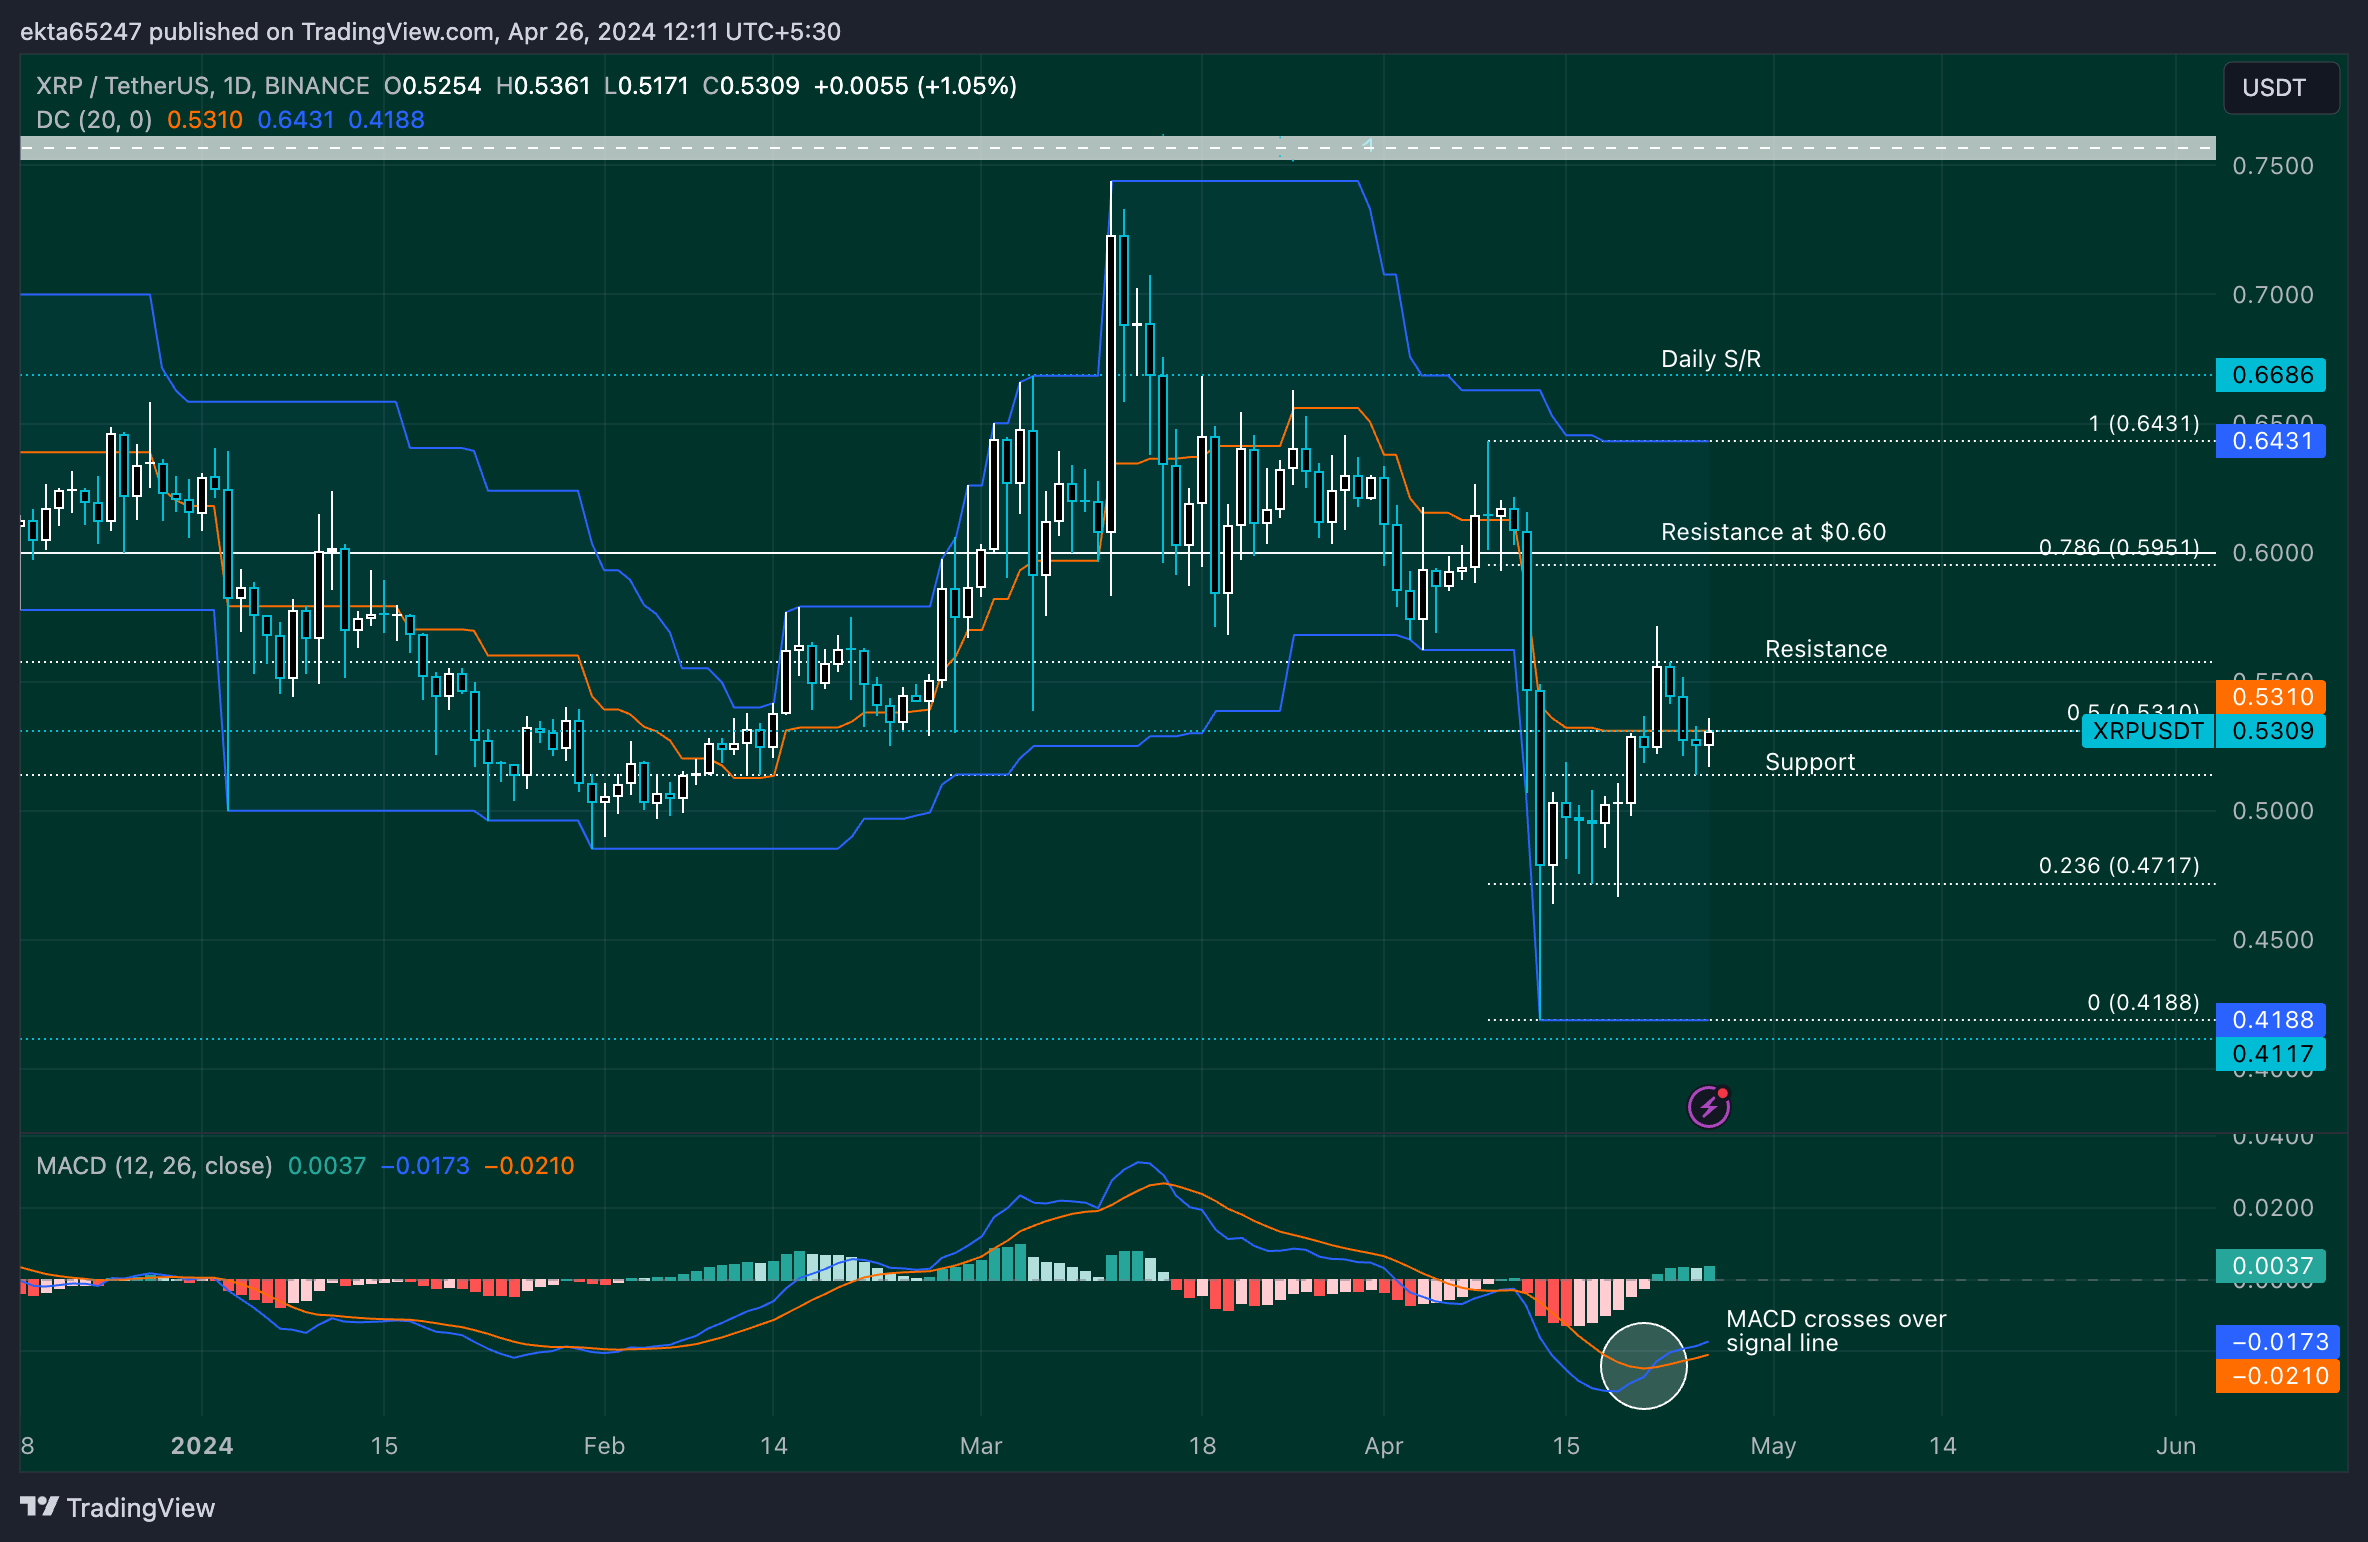
XRP hovers near $0.50 as Ripple CTO addresses concerns related to stablecoin launch
Ripple price (XRP) edges higher near the $0.53 level on Friday. The altcoin is range bound below $0.55 since Tuesday, struggling to break from sticky resistance at this level.
The XRP holder community and crypto experts recently posed questions regarding the altcoin’s utility in Ripple’s On Demand Liquidity (ODL) amid increasing concerns that XRP Ledger’s native token may fall out of use with the stablecoin’s launch set for later this year. Chief Technology Officer (CTO) David Schwartz addressed these concerns in his tweets on X, implying that both coins will have their own use and suggesting that XRP is unlikely to be overshadowed.
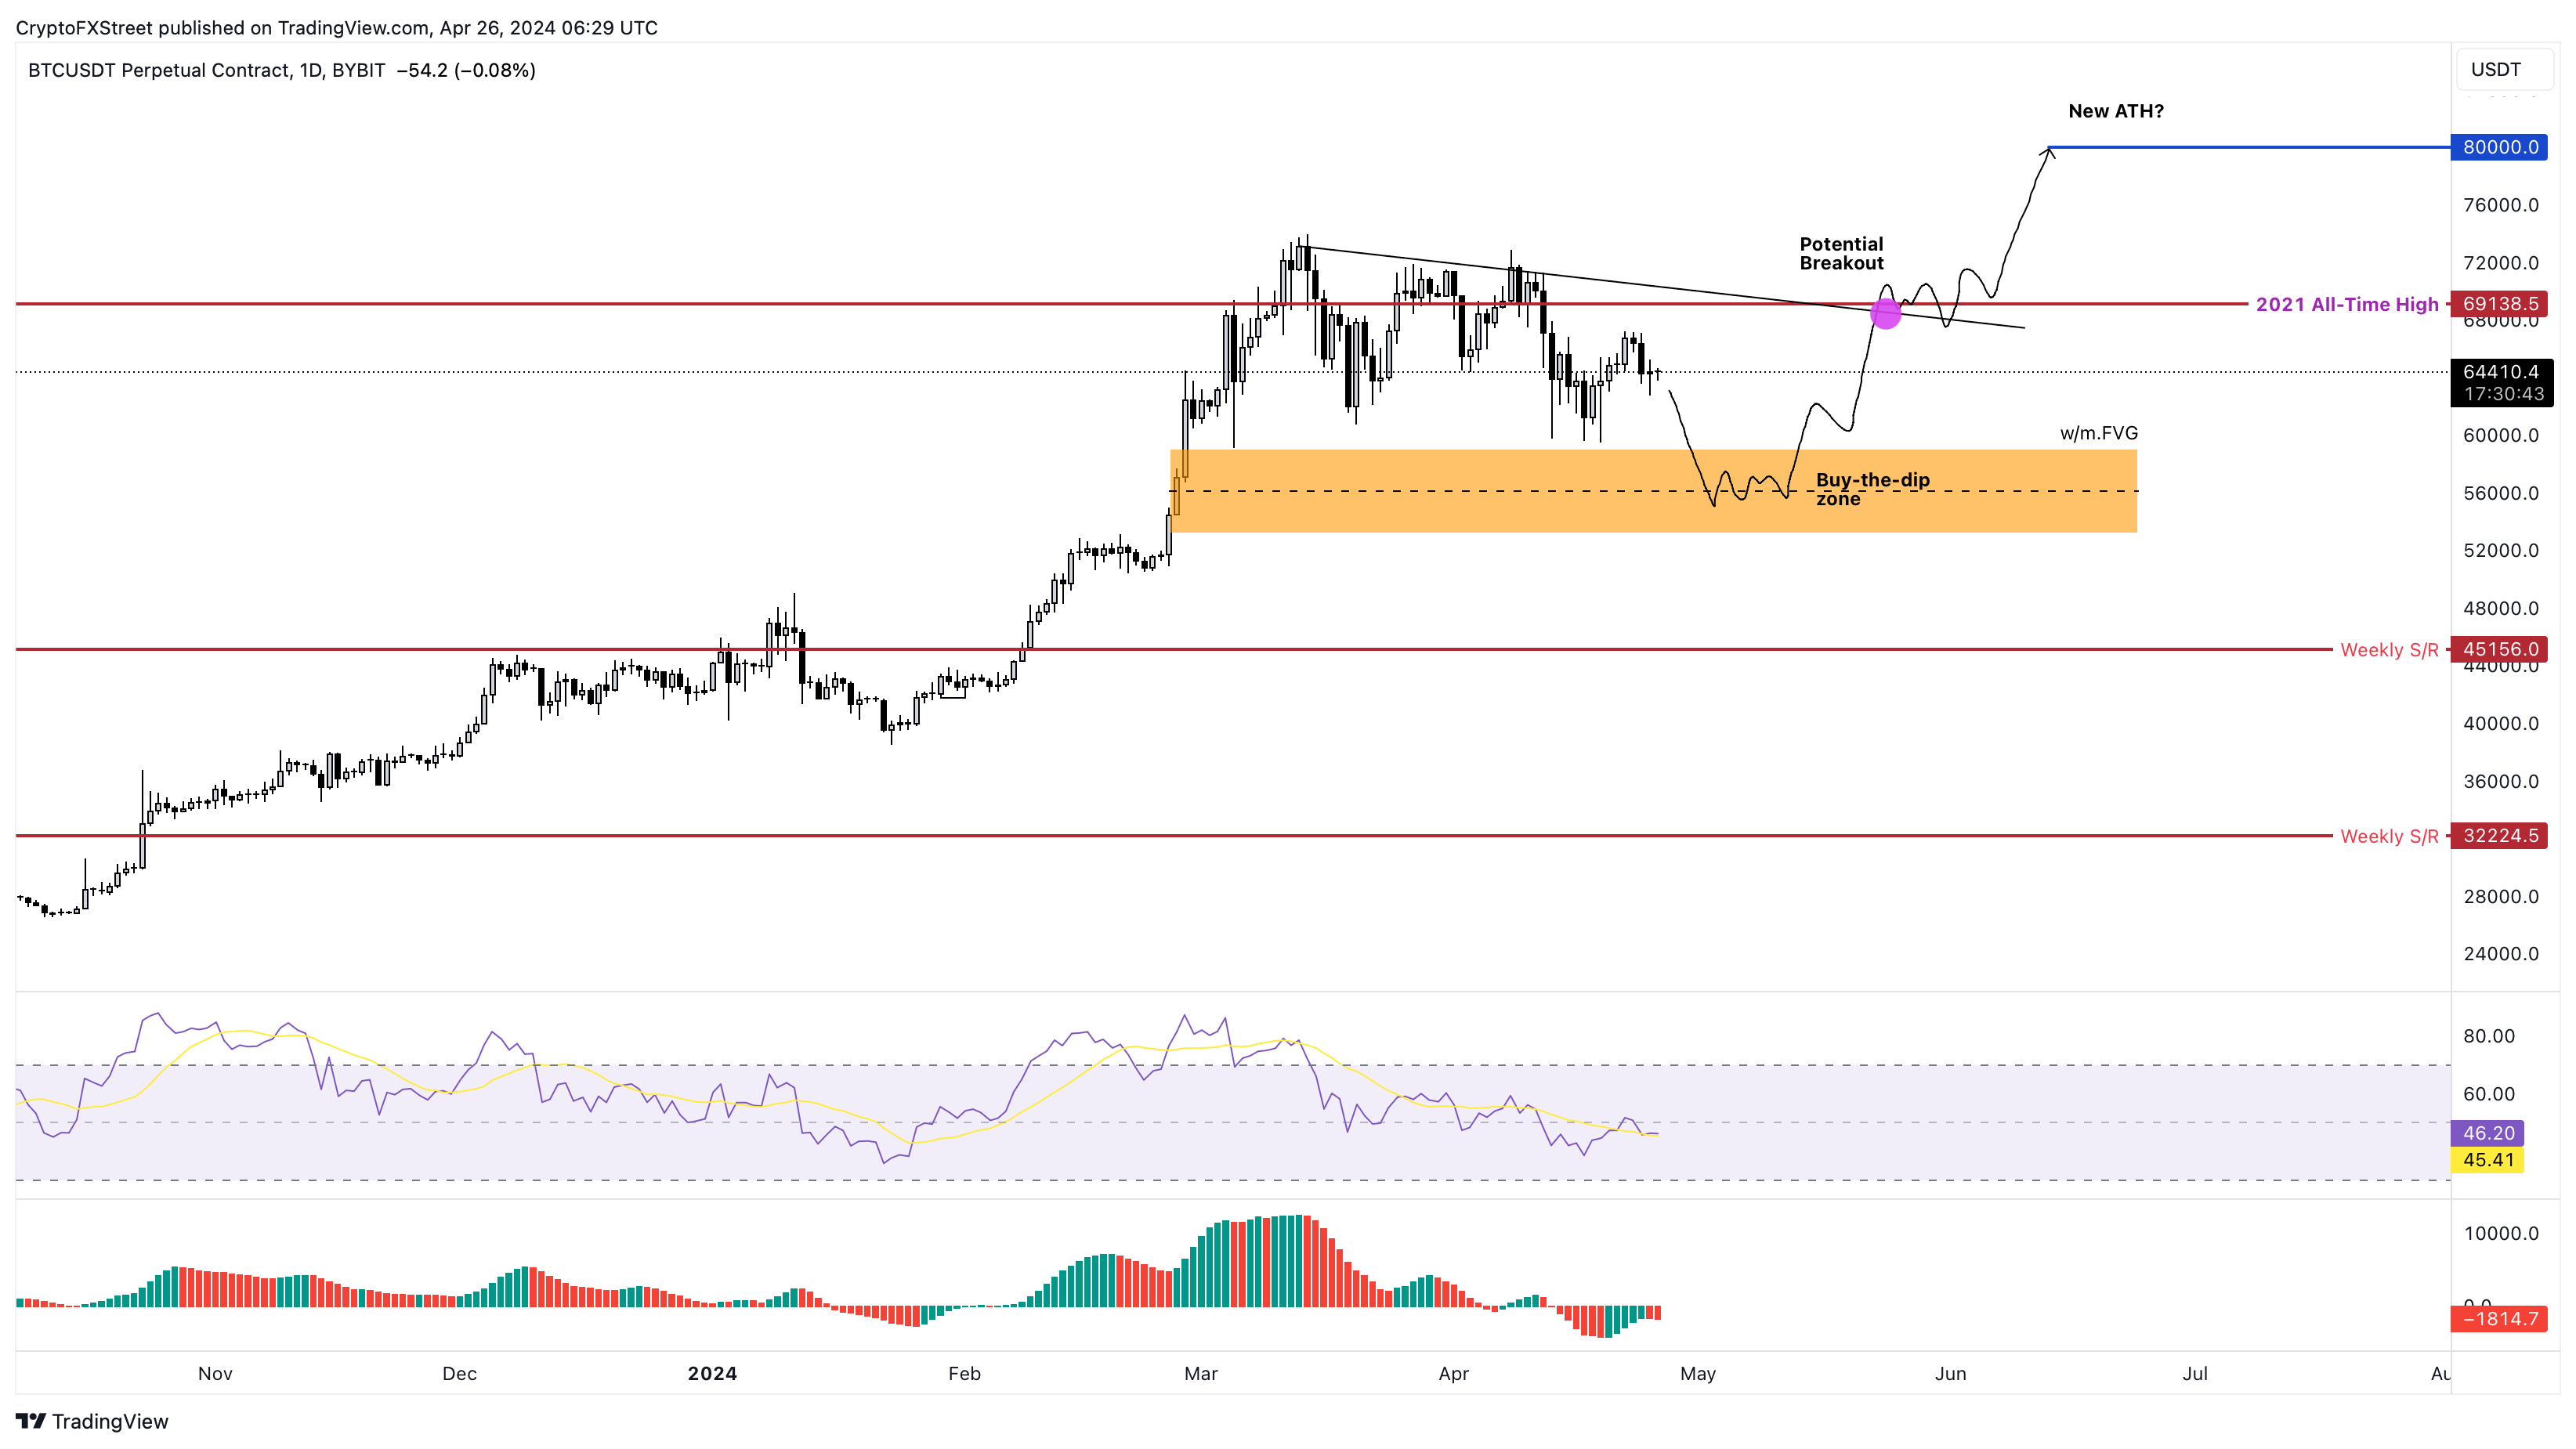
Bitcoin Weekly Forecast: BTC’s next breakout could propel it to $80,000
Bitcoin’s (BTC) recent price consolidation could be nearing its end as technical indicators and on-chain metrics suggest a potential upward breakout. However, this move would not be straightforward and could punish impatient investors.
Bitcoin price has been hovering above the imbalance on the weekly chart, extending from $59,111 to $53,120, failing to dip into it. As mentioned in previous forecasts, this inefficient zone is key for potential buy-the-dip orders to be triggered. To make the corrective outlook more compelling, investors can observe the set of equal lows formed just above the aforementioned imbalance’s upper limit of $59,111.
ChainLink Elliott Wave technical analysis [Video]
ChainLink/U.S. dollar(LINKUSD)Trading Strategy: The second wave correction is likely to go down to test the 10.585 level before rising again in the third wave. Therefore, the overall picture is a short-term pullback to continue rising. Wait for the correction to complete to rejoin the trend
ChainLink/U.S. dollar(LINKUSD)Technical Indicators: The price is above the MA200 indicating a Downtrend, The Wave Oscillator is a Bearish Momentum.
Author

FXStreet Team
FXStreet


