Crypto.com Price Prediction: CRO risks further fall, 50% correction imminent
- Crypto.com price is on the verge of losing another 50%, a pessimistic target given by the prevailing chart pattern.
- Some support may emerge at the 200-day SMA at $0.31 before further correction.
- The bulls may face difficulty in overcoming $0.46 if the buyers manage to reverse the period of underperformance.

Crypto.com price fell 18% after dropping below a critical line of defense on January 17. CRO is now at risk of plunging 50% toward the bearish forecast projected by the prevailing chart pattern.
Crypto.com price could lose half of its value
Crypto.com price has sliced below the lower boundary of the symmetrical triangle pattern on January 17 on the daily chart. The recent weakness in momentum put a 50% decline on the radar toward $0.17, a bearish target given by the governing technical pattern.
The Arms Index (TRIN), which gauges overall market sentiment, flashed a reading of 1.61, suggesting that there are significantly more CRO sellers than buyers in the market.
The first line of defense for Crypto.com price is at the support line given by the Momentum Reversal Indicator (MRI) at $0.35. An additional foothold may emerge at the 200-day Simple Moving Average (SMA) at $0.31.
Crypto.com may also be able to discover a reliable line of defense at the November 4 low at $0.27 before dropping toward the 127.2% Fibonacci extension level at $0.22.
Before Crypto.com falls toward the bearish target at $0.17, CRO may find credible support at the November 1 low at $0.20.
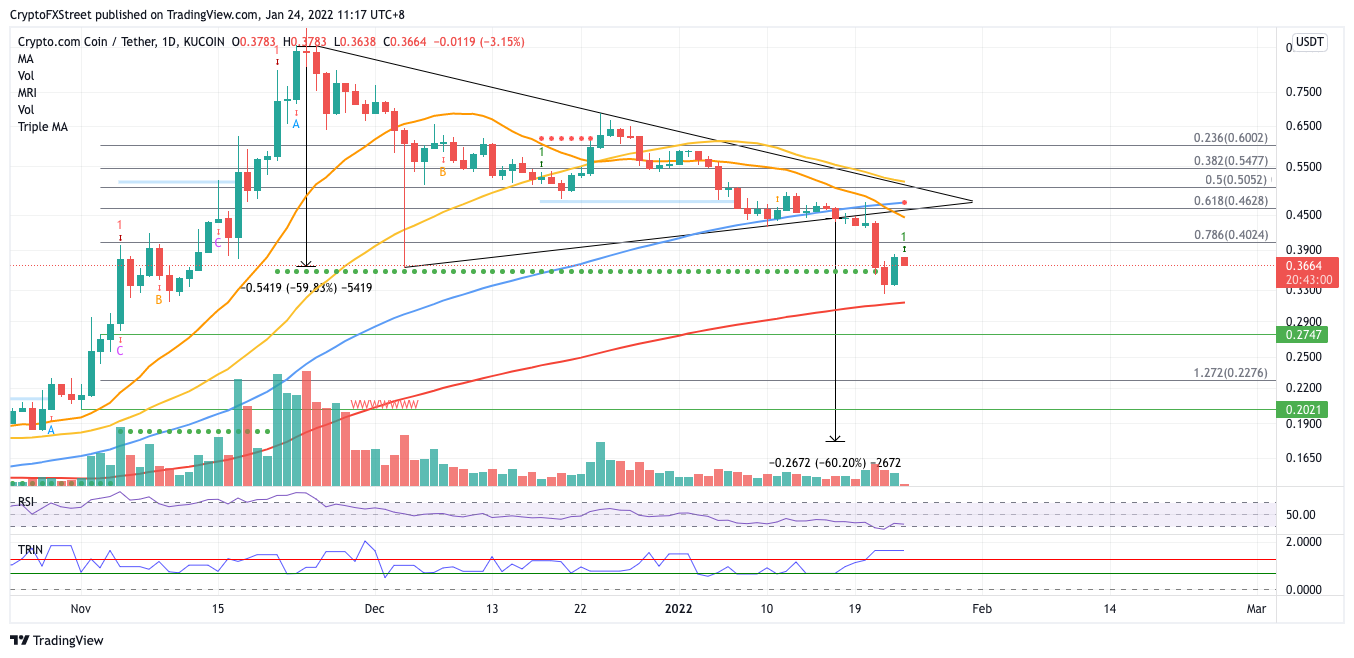
CRO/USDT daily chart
However, if buying pressure increases, CRO may face its first obstacle at the 78.6% Fibonacci retracement level at $0.40. An additional hurdle may appear at $0.46, where the lower boundary of the prevailing chart pattern, 61.8% Fibonacci retracement level, 21-day SMA and 100-day SMA intersect.
The aforementioned resistance may be tough for the bulls to conquer, but an additional spike in buy orders can push CRO higher toward the upper boundary of the governing technical pattern at $0.50, where the 50-day SMA and 50% retracement level intersect.
RELATED CONTENT
Crypto.com gives up 7% gain post Fed, CRO at a make-or-break point
Crypto.com price was handed a massive rejection move during the Wednesday trade session – as did the broader cryptocurrency market. As a result, the interpretation of Wednesday's candlestick leans heavily on the bearish side of the trade, but a continuation move south is not a foregone conclusion. Crypto.com price may be positioned for a retracement to the 61.8% Fibonacci retracement at $0.37. However, the daily oscillators give mixed signals on how likely that drop may be. The Relative Strength Index is in neutral territory and of no help in determining a bias. The Optex Bands oscillator, on the other hand, is just turning up and moving out of extreme oversold conditions – signaling a likely bull move coming up. Conversely, the Composite Index has a higher high while the candlestick chart has a lower high – a condition known as hidden bearish divergence, a warning sign that the current corrective move higher is likely to terminate and the trend will continue south. If CRO bulls can push a close above $0.47, that would invalidate the hidden bearish divergence.Read more
Author

Sarah Tran
Independent Analyst
Sarah has closely followed the growth of blockchain technology and its adoption since 2016.


