Compound Price Analysis: COMP is on the verge of a steep decline following a 130% bull rally
- Compound price had a significant 130% rally since January 22 topping out at $377.
- The digital asset seems poised for a correction as several indicators have turned bearish.
- COMP could fall towards the psychological level at $300 in the short-term.

Compound, like the rest of the DeFi sector, had a significant rally in 2021, jumping from a low of $134 on January 1 to $377 on February 1. The digital asset is now overextended and on the verge of a significant but healthy correction.
Compound price could fall as low as $300
The TD Sequential indicator has presented a sell signal on the daily chart, after five consecutive days of gains. The digital asset hasn’t experienced a significant correction since January 18.
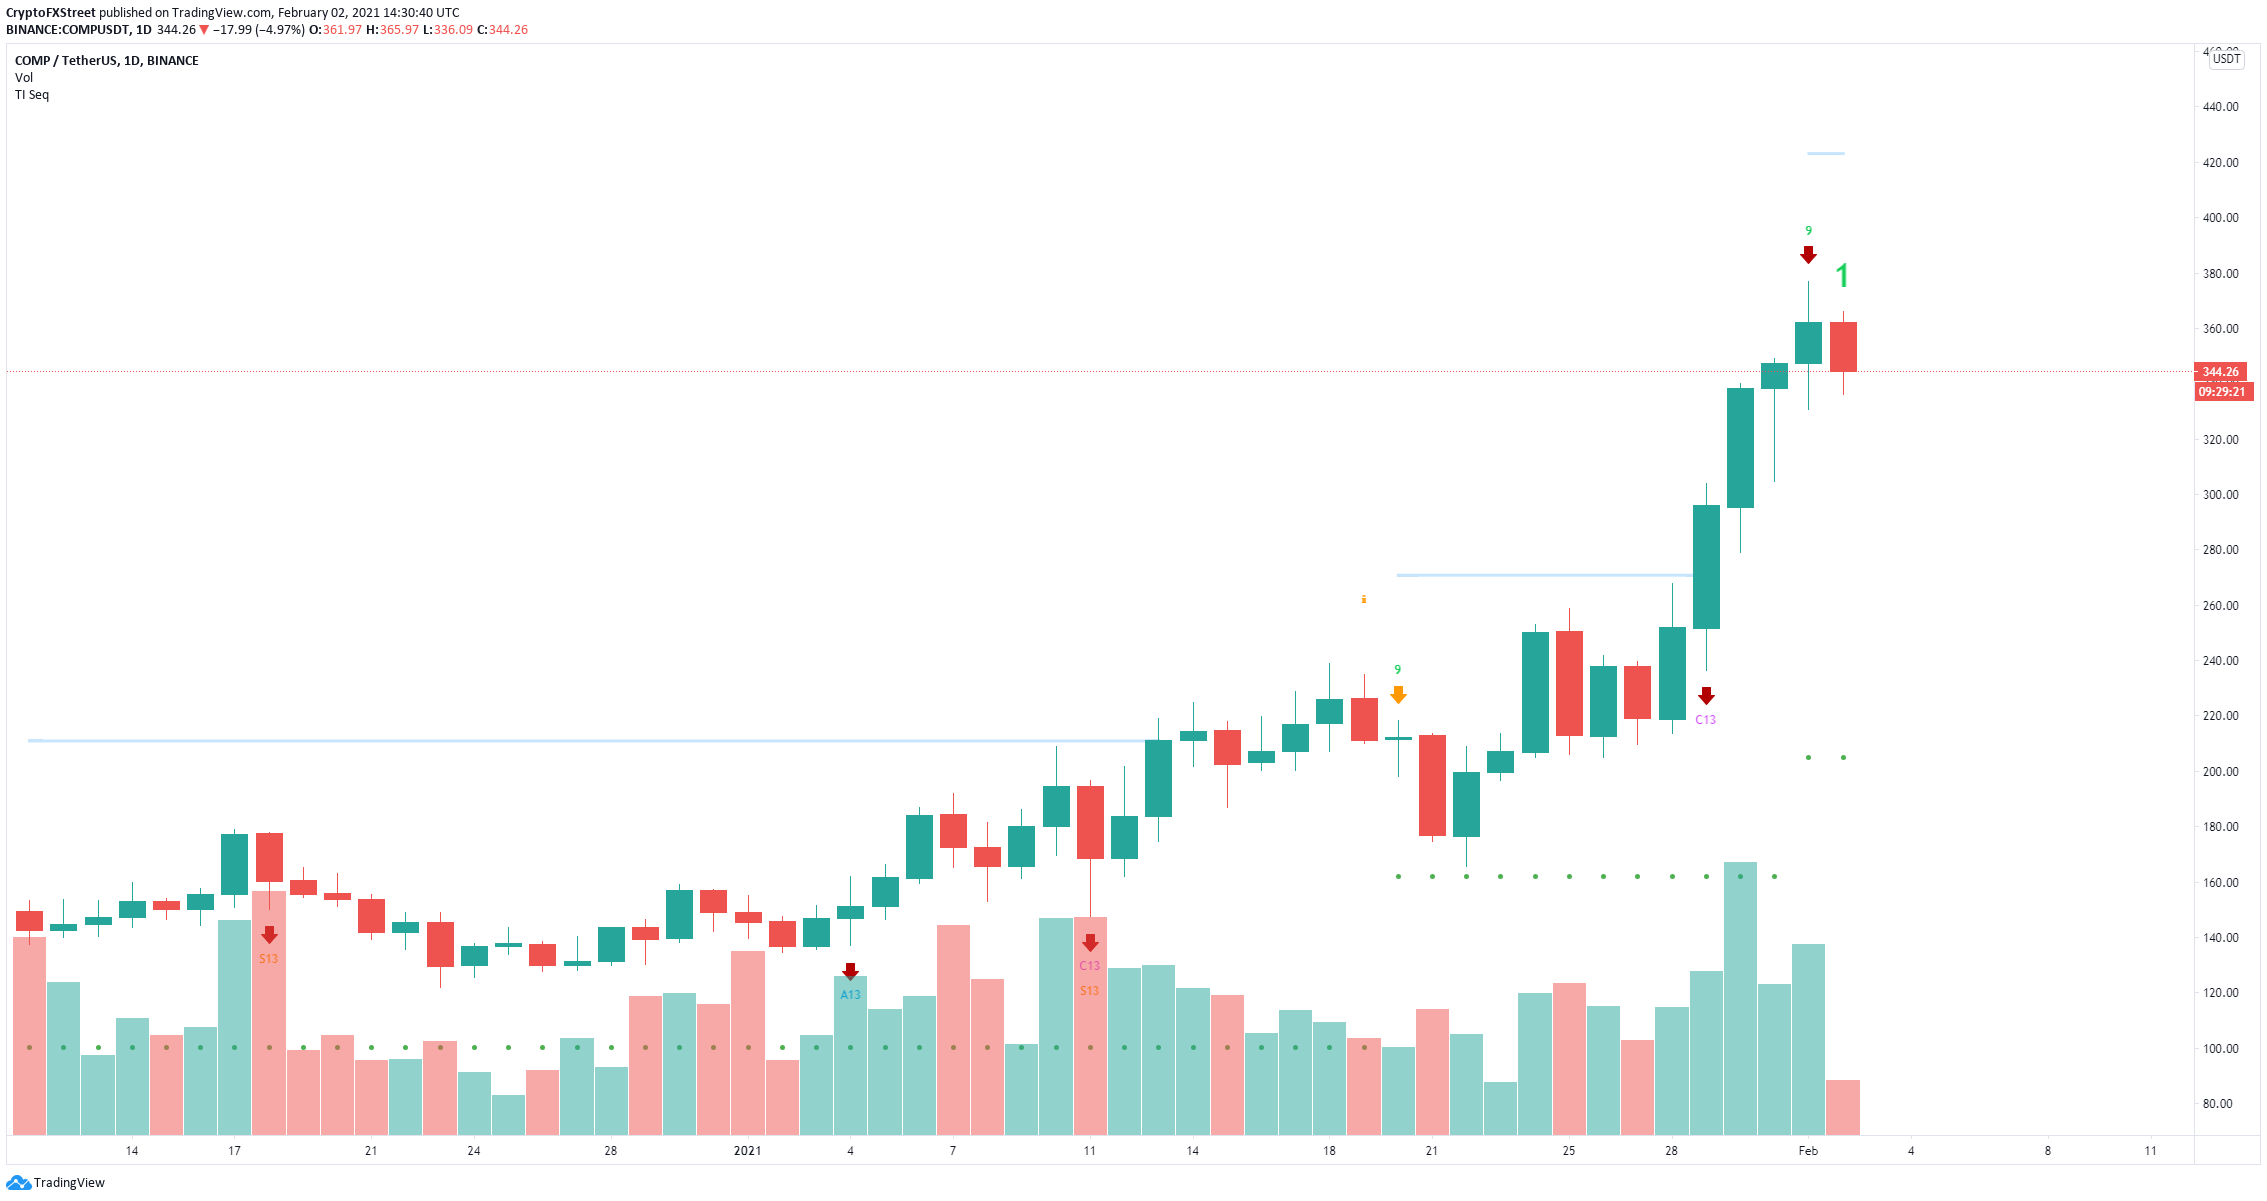
COMP/USD daily chart
The MVRV (30d) chart is extremely overextended into the danger zone above 28%, which historically has lead COMP towards heavy corrections back in August, September, and November 2020.
%20[15.32.02,%2002%20Feb,%202021]-637478734370349512.png)
COMP MVRV (30d) chart
The In/Out of the Money Around Price (IOMAP) chart shows that the most significant support area is located between $304 and $315, with 122,000 COMP in volume and 1,450 addresses. Validation of the sell signal on the daily chart can push Compound price down to $300.
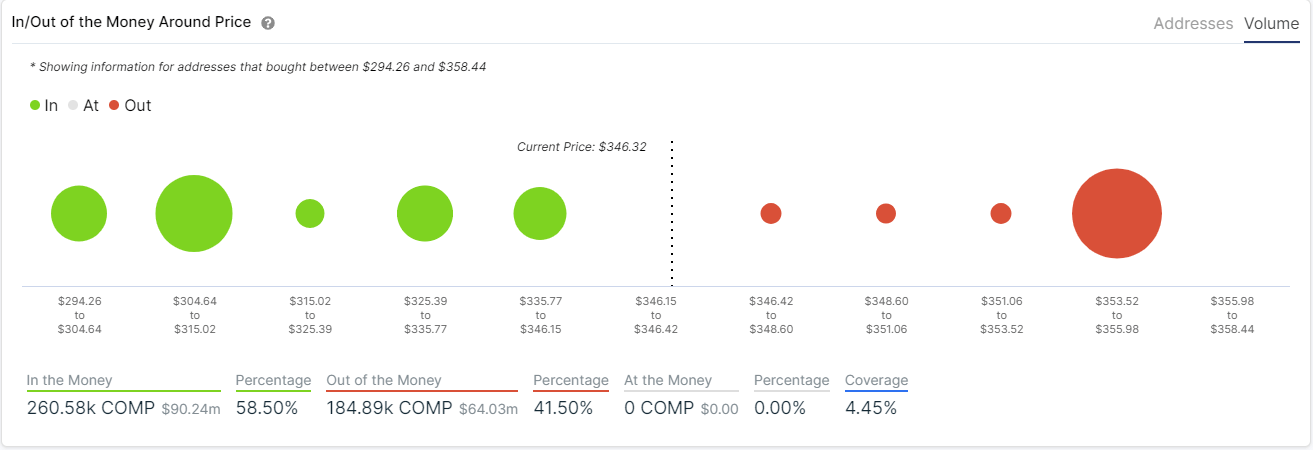
COMP IOMAP chart
However, the IOMAP chart also indicates that there is practically no resistance above $340 until $355. A breakout above $355 can quickly push Compound price to the all-time high of $377.
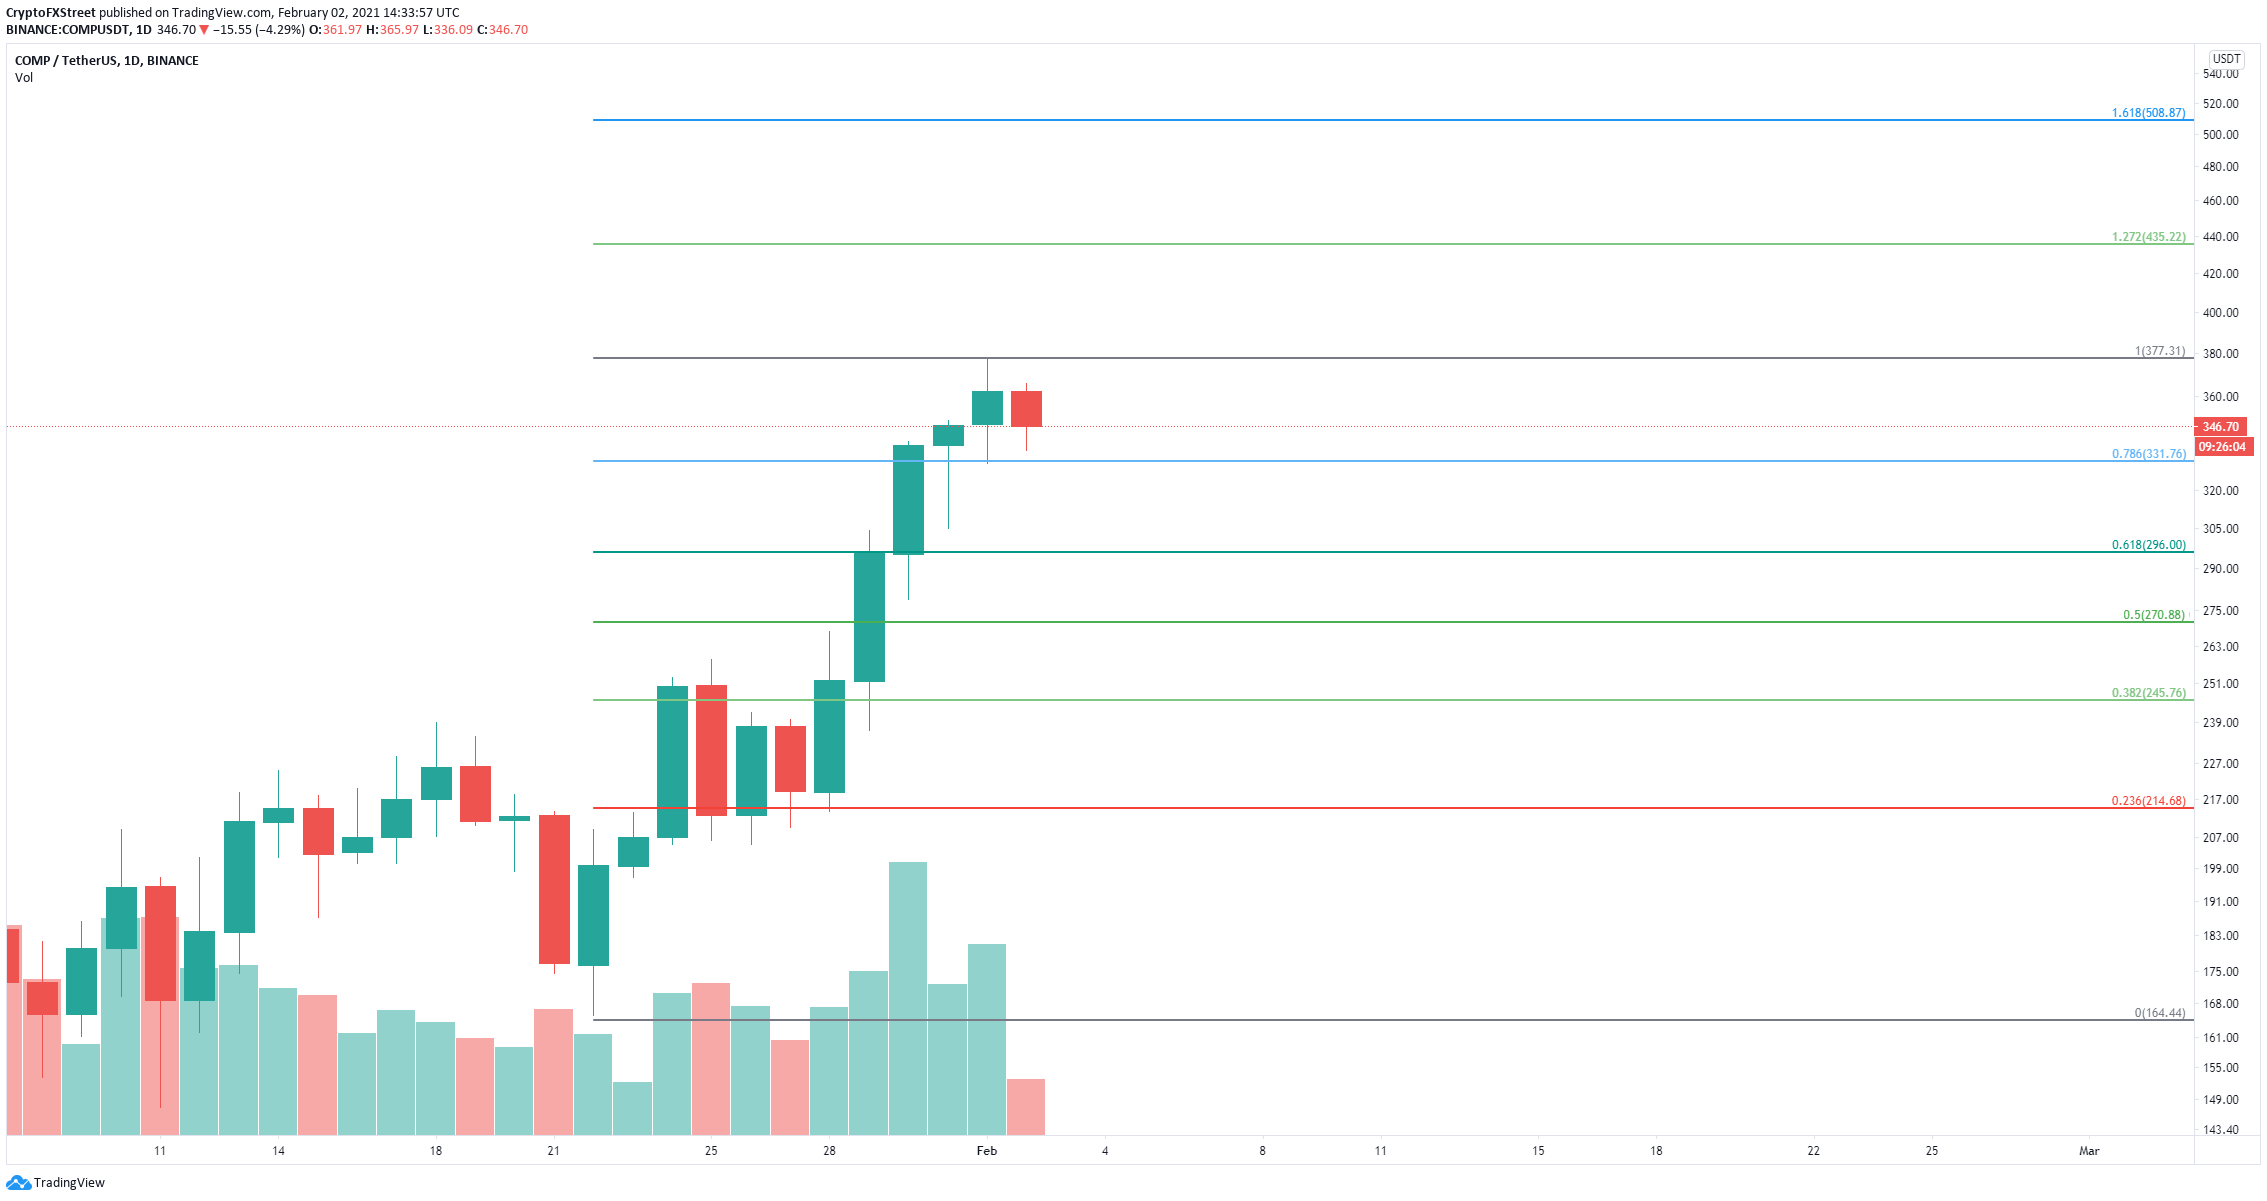
COMP/USD daily chart
Using the Fibonacci Retracement tool, other potential price targets can be determined on the way up, besides the all-time high. At the 127% level ($435) we find the nearest but Compound price could potentially climb towards $508 at the 161.8% level.
Author

Lorenzo Stroe
Independent Analyst
Lorenzo is an experienced Technical Analyst and Content Writer who has been working in the cryptocurrency industry since 2012. He also has a passion for trading.


