Compound Price Analysis: TD sequential flashes buy signal on COMP daily chart
- COMP has bounced up from the 20-day Bollinger lower band, following four straight bearish days.
- Upside potential capped at $140, as per IntoTheBlock’s “In/Out of the Money Around Price” (IOMAP) model.

COMP/USD daily chart has shown a buy signal this Monday, as per TD sequential. Prior to that, COMP has had four straight bearish sessions, during which it fell from $158.40 to $128.50.
COMP/USD daily chart
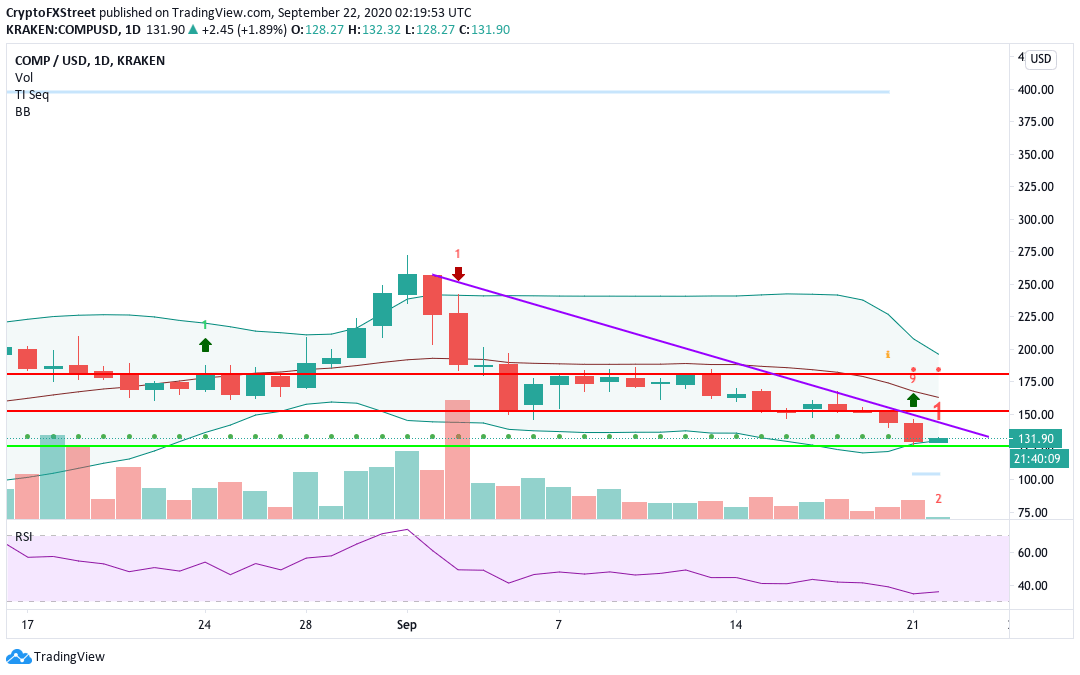
This Tuesday, the price has bounced up from the lower curve of the 20-day Bollinger Band. Mirroring the price, the relative strength index (RSI) has gone up slightly from 35.75 to 37. The 20-day Bollinger jaw has constricted, which indicates decreasing price volatility.
COMP IOMAP
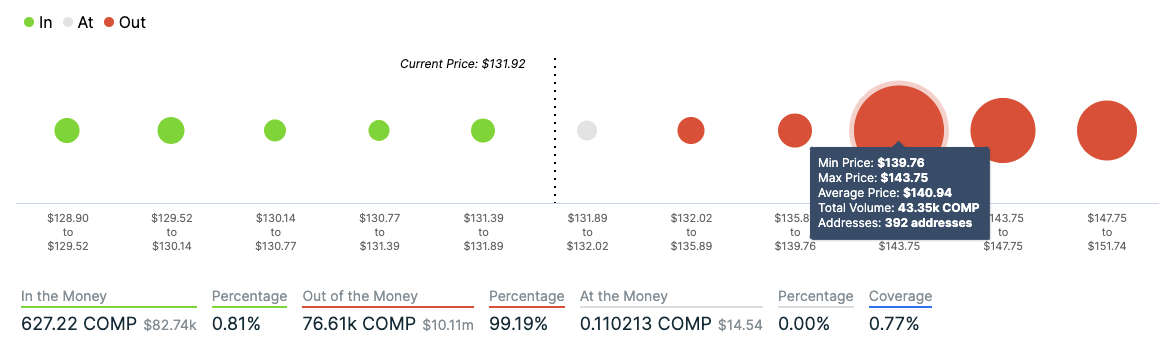
IntoTheBlock’s “In/Out of the Money Around Price” (IOMAP) model estimates that $141.75 plays a vital role in Compound’s trend. Transaction history shows that this is the largest resistance wall above the erstwhile DeFi leader that could reverse the upcoming bullish trend. In the $141.75-level, nearly 400 addresses are holding a little over 43,000 COMP tokens.
On the downside, if the bears take back control, the drop in price could be catastrophic. The lack of healthy support walls shows that the price may drop all the way down to $129.50 under selling pressure.
COMP on-chain
Age consumed
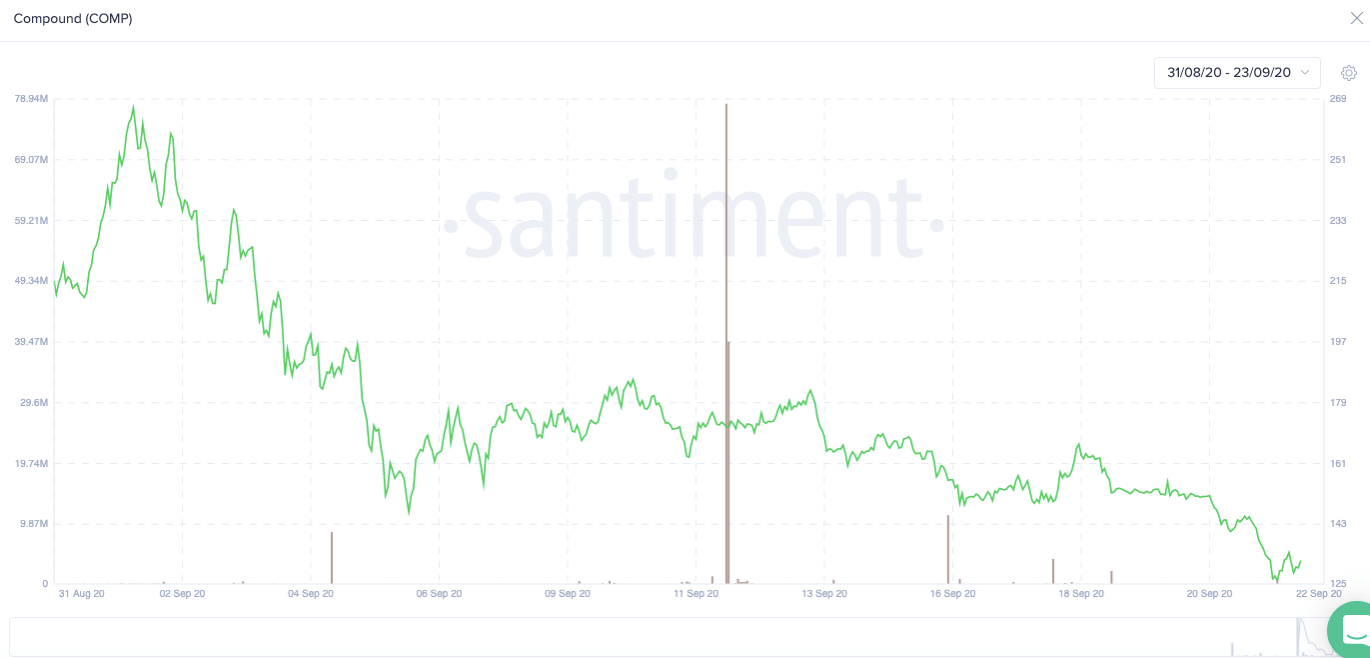
A spike in the age consumed graph usually triggers a sharp movement, which could be both positive or negative. As per the chart, there was a spike on 16th September, wherein the price dropped from $364.60 to $394 over the next two days. Following that, the bears dropped the price to $344.85.
COMP TVL

TVL or Total Value Locked is the amount of USD (and Ether) locked in DeFi smart contracts. Since September 9th, the amount locked up in Compound has gone up from $589M to $708M. As more investors lock up their stake in Compound, it makes the overall network healthier.
Author

Rajarshi Mitra
Independent Analyst
Rajarshi entered the blockchain space in 2016. He is a blockchain researcher who has worked for Blockgeeks and has done research work for several ICOs. He gets regularly invited to give talks on the blockchain technology and cryptocurrencies.


