Chainlink Price Prediction: LINK hints at reversal after 25% crash
- Chainlink price suggests a reversal could be coming as indicated by TD Sequential indicator’s buy signal.
- A decisive close above 61.8% Fibonacci retracement level adds credence to bullish thesis.
- Transactional data shows a stable demand barrier at $22.40 that could defend any downside move in LINK.
-637336005550289133.jpg)
The Chainlink price seems primed for a reversal after selling pressure gets absorbed by a stable support level.
Chainlink price eyes higher high
The Chainlink price has been range-bound for almost a month. LINK’s recent move led to a 25% crash that found support on the 78.6% Fibonacci retracement level at $24.18.
Meanwhile, the Tom DeMark (TD) Sequential indicator flashed a buy signal in the form of a red nine candlestick on the 12-hour chart.
This signal suggests that the downtrend is likely to be exhausted and projects a one-to-four candlestick upswing for the Chainlink price. While the current candles show signs of reversal, a reliable confirmation will come when the green two candlestick closes above the green one.
A candlestick close above the 61.8% Fibonacci retracement level at $26.93 will serve as a secondary confirmation. In that case, the Chainlink price will be primed for the next leg up, which could propel it by 11% toward the State Trend Support at $30.1.
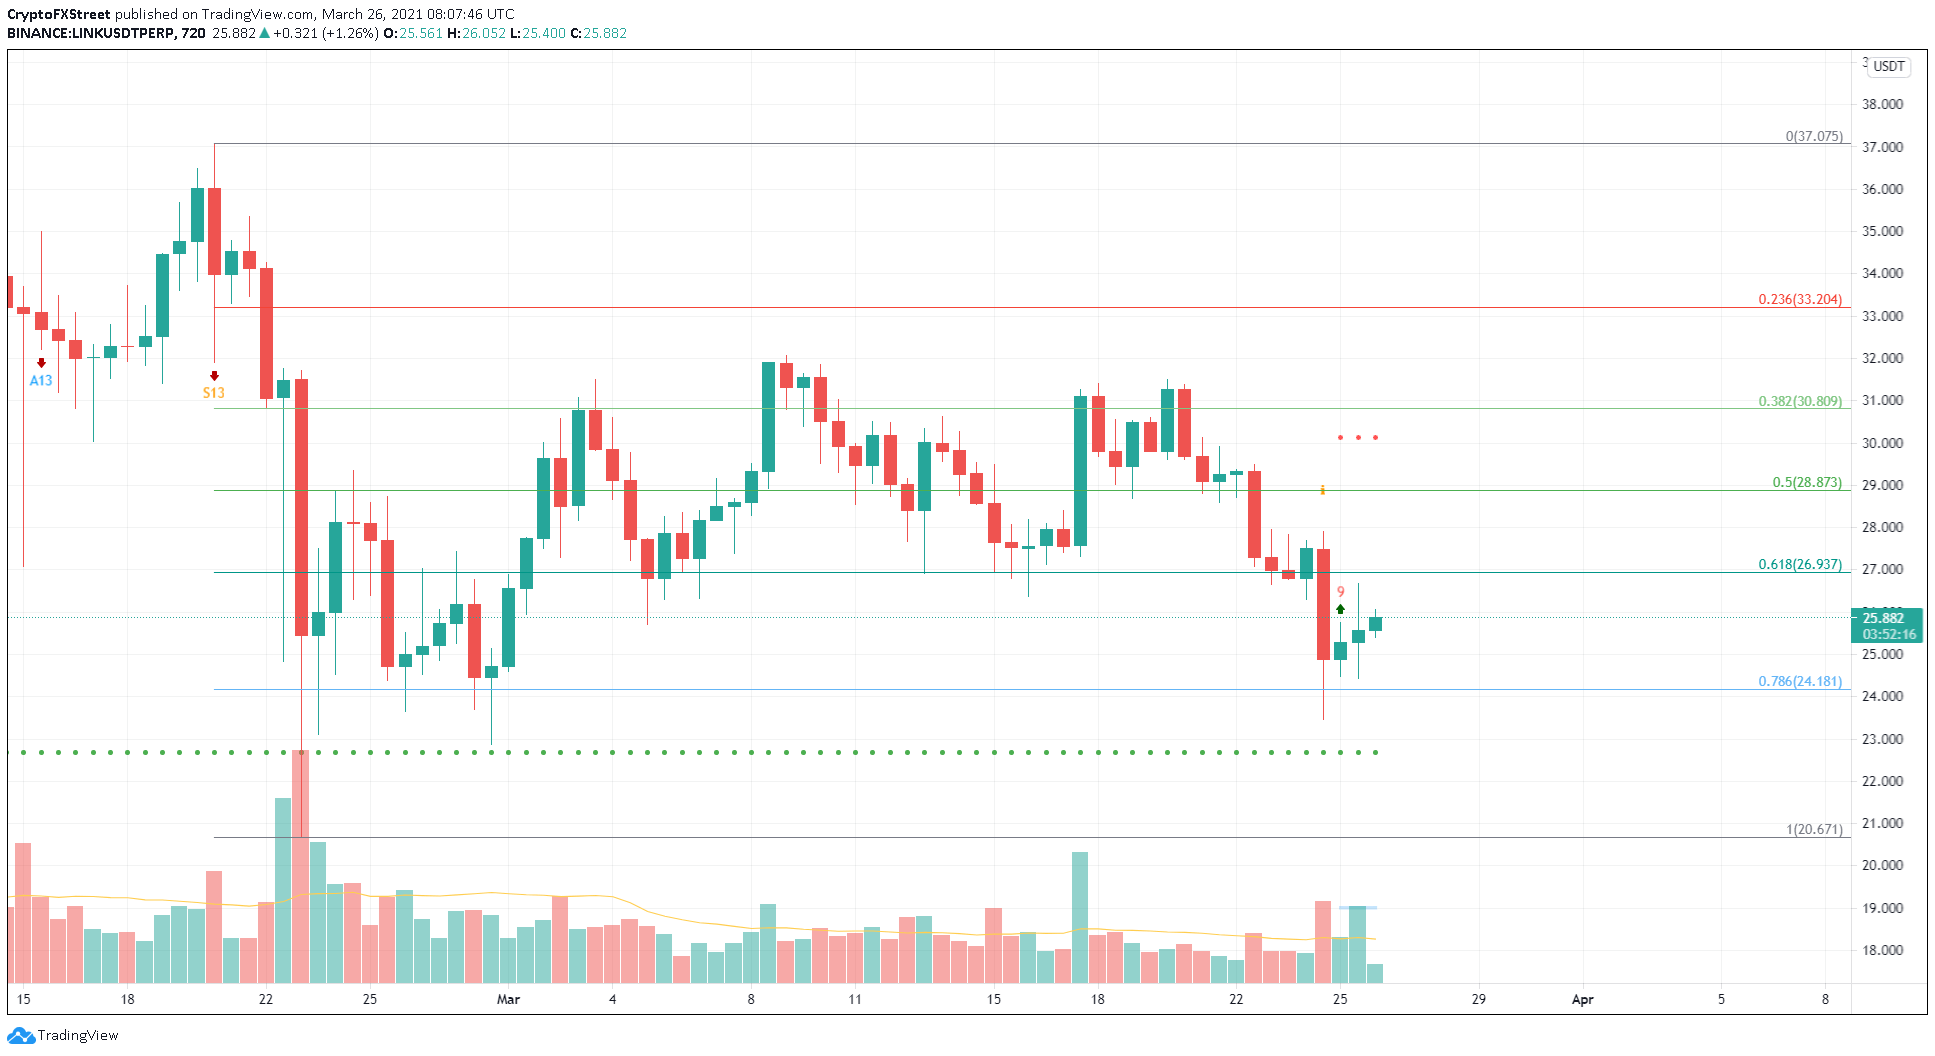
LINK/USDT 12-hour chart
Regardless of the bullish outlook, investors need to be wary about a move to the downside. If Chainlink’s price manages to slide below $21.18, it will result in a 6% downswing toward a crucial support level at $22.64, which coincides with the TD Sequential indicator’s State Trend Support.,
Interestingly, IntoTheBlock’s In/Out of the Money Around Price (IOMAP) model shows that nearly 12,800 addresses have purchased 4.25 million LINK tokens here.
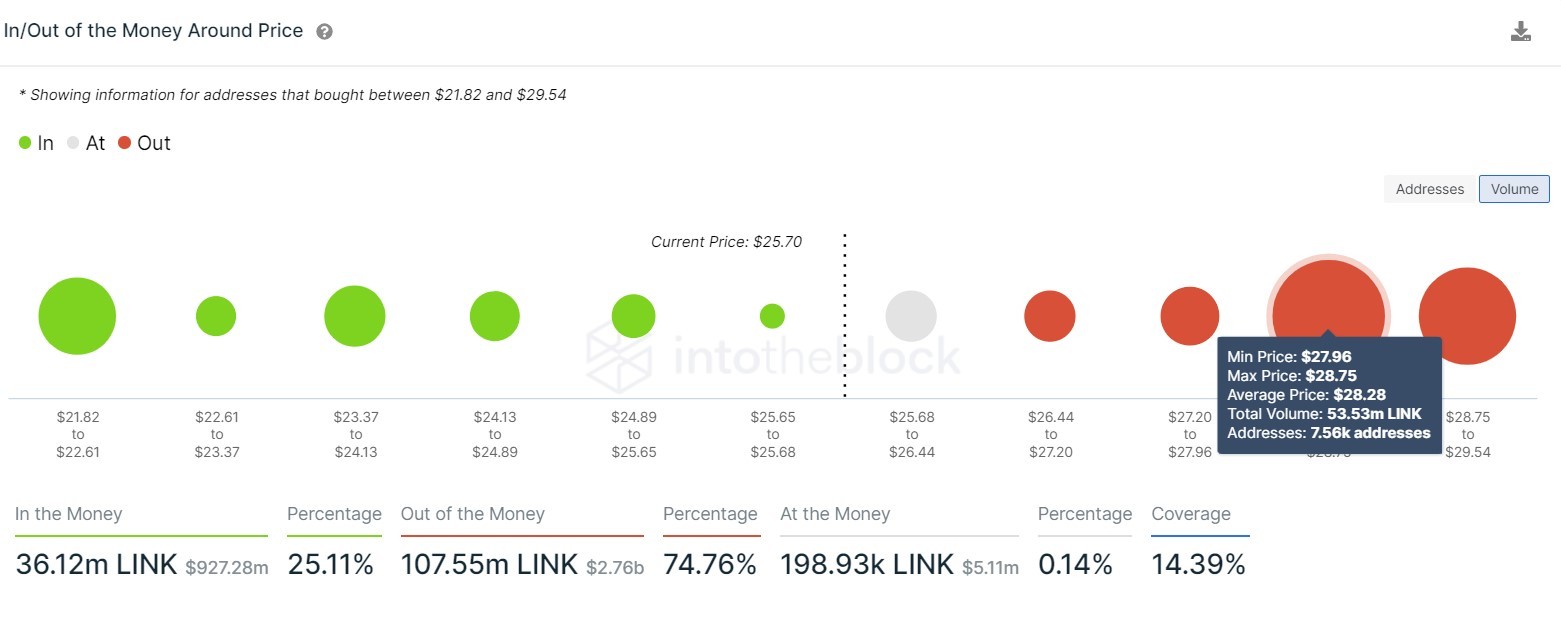
Chainlink IOMAP chart
The situation becomes bleak if the demand barrier at $22 fails. In such a case, the oracle token can be expected to slide at least 13% to another crucial level at $19.58.
Author

Akash Girimath
FXStreet
Akash Girimath is a Mechanical Engineer interested in the chaos of the financial markets. Trying to make sense of this convoluted yet fascinating space, he switched his engineering job to become a crypto reporter and analyst.


