Chainlink Price Forecast: LINK treads on shaky ground amid seemingly imminent freefall
- Chainlink struggles to secure recovery as triangle pattern contributes to intensifying overhead pressure.
- The IOMAP illustrates a massive resistance likely to hinder upward price action.
- LINK may resume the uptrend if the MACD flips bullish in the near term.
-637336005550289133.jpg)
Chainlink recently lost crucial support provided by a key technical pattern. This opened Pandora’s box as bulls focused on securing higher support. The area at $26 remained unbroken, with LINK making a shallow rebound above $27. However, LINK’s buyers seem to be struggling with the uptrend, a situation that brings to light potential losses aiming for $19.
Chainlink under increasing gravitational pull
Chainlink’s breakdown to $20 around mid-February culminated in a considerable recovery. However, LINK failed to overcome the resistance at $32, leading to an ascending triangle. On the downside, the decentralized Oracle token sustained an uptrend, forming the hypotenuse of the triangle.
A bullish breakout is expected once the price cracks the x-axis resistance. However, a correction came into the picture due to the price sliding under the ascending trend line. If the ongoing recovery does not overcome the hurdle at $30, Chainlink may extend the breakdown toward $19, as illustrated on the chart.
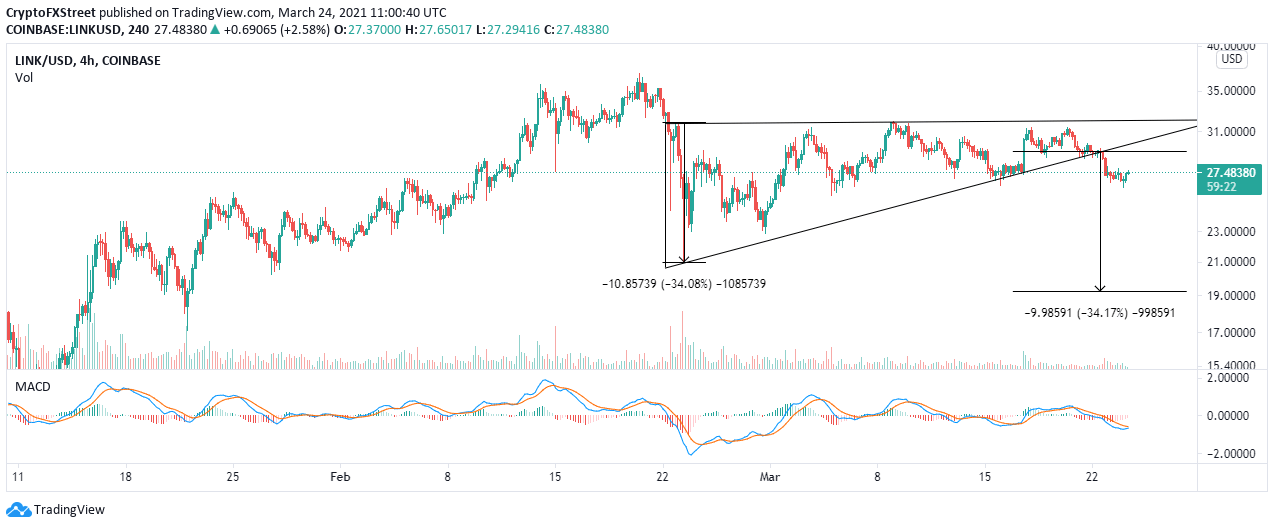
LINK/USD 4-hour chart
IntoTheBlock’s IOMAP chart highlights the immense resistance toward $30, thus invalidating recovery in the short term. The most robust seller congestion zone holds between $28.2 and $29. Here, 12,500 addresses had previously bought approximately 58.7 million LINK.
On the flip side, feeble support exists to prevent Chainlink from diving further. However, the model brings our attention to the region running from $26.5 to $27.4. Here, roughly 14,600 addresses had previously scooped up around 6.3 million LINK. This support, however, does not seem strong enough to avert the potential losses.
-637521829277885490.png)
Chainlink IOMAP chart
Looking at the other side of the picture
The 4-hour Moving Average Convergence Divergence (MACD) indicator shows a potentially bullish scenario. This bullish outlook will be validated by the MACD line (blue) crossing above the signal line. Moreover, the indicator must move into positive territory to ascertain the uptrend to higher price levels.
Author

John Isige
FXStreet
John Isige is a seasoned cryptocurrency journalist and markets analyst committed to delivering high-quality, actionable insights tailored to traders, investors, and crypto enthusiasts. He enjoys deep dives into emerging Web3 tren


