Chainlink Price Forecast: LINK uptrend is vulnerable to an abrupt change
- Chainlink price has traded in a tight range the last two weeks.
- Latest weekly volume is the lowest since June 2020.
- The 10-week simple moving average (SMA) provides support through consolidation.
-637336005550289133.jpg)
Chainlink price continues to travel in a sideways pattern after closing with a Doji candlestick two weeks ago and a mere 2.4% gain last week. Price action is reflecting an indecisive market that could be vulnerable to a notable change.
Chainlink price rises concerns among bulls
A Doji is a single candlestick pattern that resembles a cross because opening and closing prices are the same. It does indicate a market in balance between supply and demand, but it also warns traders that there is some uncertainty and indecisiveness.
Two weeks ago, LINK closed with a Doji pattern warning traders that the rebound off the February lows was exhausted and the probability of decline had shifted higher. Traders hate uncertainty, particularly in the context of an uptrend. They showed it last week as the altcoin gained a negligible 2.4%, where the weekly volume was the lowest since the week beginning June 29, 2020.
As long as Chainlink price holds, the 10-week SMA traders should be looking for bullish outcomes from the current consolidation. A daily close above the high from two weeks ago at $32.00 will be the first step in restarting the rebound from the February low. The subsequent profit target is the all-time high at $36.92, generating a 28% gain from the current price level.
If volume re-enters the market, more generous profit targets are the 1.382 and 1.618 Fibonacci extension levels at $43.00 and $46.76, intersected by the topside trendline running from the 2019 high.
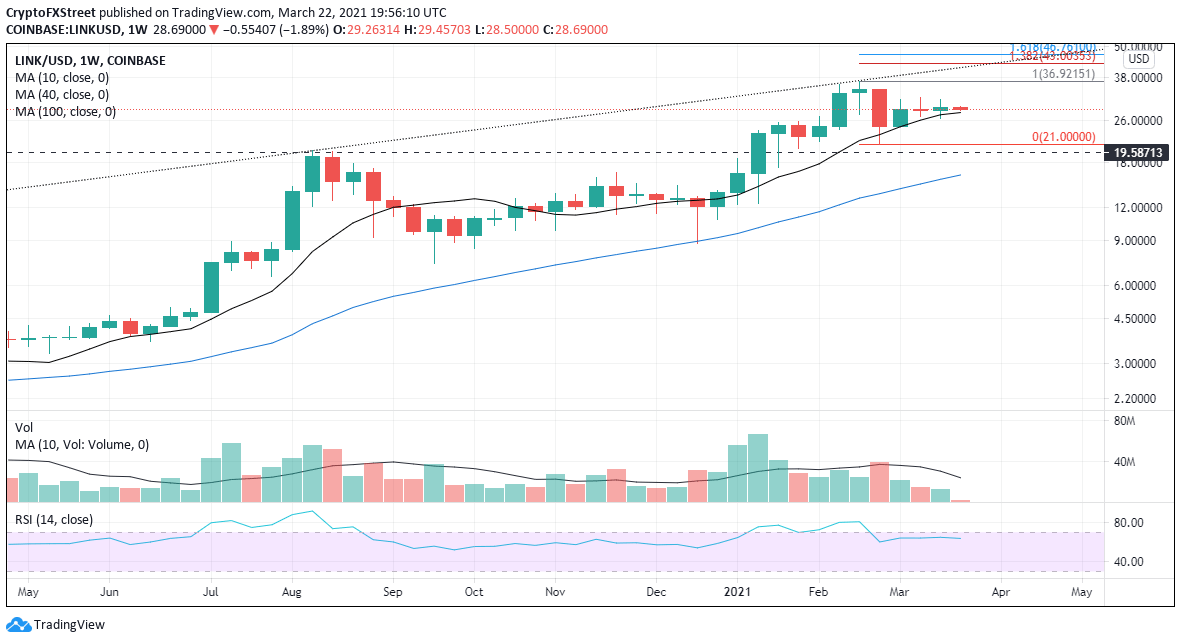
LINK/USD weekly chart
A move to the downside needs to hold the 10-week SMA at $27.94, or Chainlink price could collapse to the February low at $21.00 in quick fashion.
Author

Sheldon McIntyre, CMT
Independent Analyst
Sheldon has 24 years of investment experience holding various positions in companies based in the United States and Chile. His core competencies include BRIC and G-10 equity markets, swing and position trading and technical analysis.



