Chainlink Price Forecast: LINK positioned for new all-time highs
- Chainlink price matches largest weekly decline with the best weekly advance since June 2019.
- LINK discovered support just below the 78.6% Fibonacci retracement of the 2021 rally before generating a 136% bounce.
- Topside trend line remains the primary resistance to an explosive march higher.
-637336005550289133.jpg)
Chainlink price fools bearish investors with a 136% rebound, leaving the digital asset 50% away from an all-time high. The v-shaped recovery for LINK raises the probability that it will test new highs in the medium term if the crypto market remains steady, or preferably with an upward bias.
Chainlink price liquidation was a reset, not the beginning of the end
Chainlink price, at the May 19 low had collapsed 50%, slicing through the 50-day SMA and the 200-day SMA. A knee-jerk reaction did materialize from the area of the 200-day SMA, but LINK soon collapsed another 35% on May 23, shaking out the remaining weak holders and the dip-buying enthusiasts from May 19. The day ended with the largest volume for a negative day since July 13, 2020, and delivered the lowest daily Relative Strength Index (RSI) reading since the September 2020 correction.
The 136% rebound from the May 23 low has positioned Chainlink price at the 50% retracement of the May decline at $33.99 and above the strategically important 200-day SMA. The confluence of the 50-day SMA at $37.66 with the 61.8% retracement at $38.47 will demand considerable buying pressure that should arrive after a pause or mild correction for LINK.
A successful LINK breakout above the resistance mentioned above should energize Chainlink price to test the 78.6% retracement at $44.86 and then the topside trend line at $51.25 that began in July 2019. The final resistance to rewarding returns is the all-time high on May 10 at $52.99.
Chainlink price will strike new resistance at the 138.2% extension of the May decline at $67.50 and possibly the 161.8% extension at $76.46.
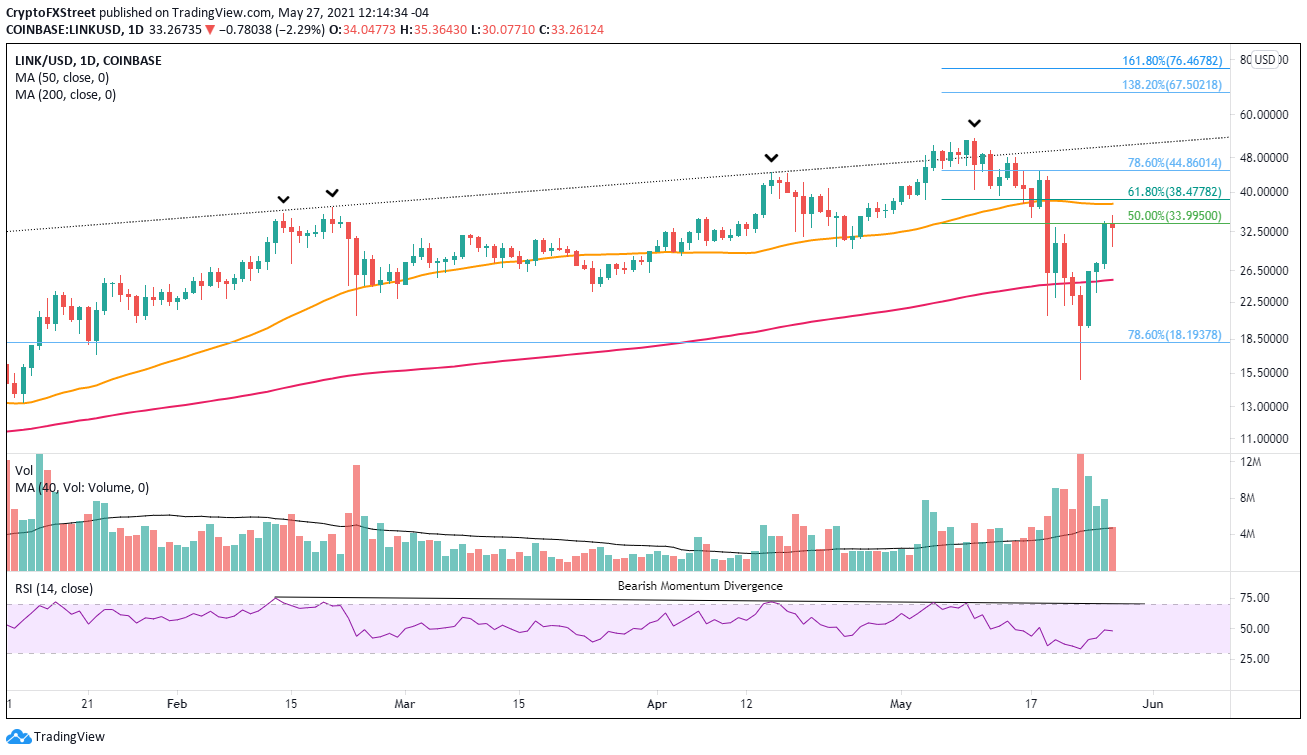
LINK/USD daily chart
The emerging doji candlestick today may be signaling that the bounce is exhausted, and the inevitable pullback to release the price compression of the orderly v-shaped recovery is at hand. It will encounter support at the April 25 low at $29.85. Additional support comes at the 200-day SMA at $25.29. Any weakness below $25.00 will signify that a more complex bottom is developing, or LINK is still searching for a definitive low.
Author

Sheldon McIntyre, CMT
Independent Analyst
Sheldon has 24 years of investment experience holding various positions in companies based in the United States and Chile. His core competencies include BRIC and G-10 equity markets, swing and position trading and technical analysis.


