Chainlink price bounces despite crypto bloodbath
- Chainlink price pauses at the confluence of two significant support levels on the daily chart.
- LINK registered two bearish engulfing days on the bar charts since the May 10 high.
- Daily and weekly Relative Strength Indexes (RSI) are no longer overbought.
-637336005550289133.jpg)
Chainlink price is at a pivotal point on the charts as it battles with outstanding support provided by the near intersection of two significant support levels. The downside should be limited for LINK in the short term unless the cryptocurrency complex sustains further selling pressure in the days ahead.
Chainlink price shakes out weak holders
From May 4 to May 10, Chainlink price renewed the struggle with the topside trend line that halted a rally in February and April. The eventual failure established the conditions for a meaningful short-term top and the beginning of a necessary corrective process.
Over the last eight days, Chainlink price has fallen 34% from the May 10 high at $52.99 to today’s low at $35.13. The decline was framed by two bearish engulfing days showing investors were eager to sell strength. For interest’s sake, the fall is similar in magnitude to the April correction that was followed by an 80% rally.
LINK has released the mild overbought conditions on the daily and weekly RSI during the corrective process, setting the digital token up for a new rally.
A daily close above the 50-day simple moving average (SMA) at $38.00 will be the first alert to investors that the May correction is complete and Chainlink price has begun a bottoming process or, potentially, ready to snap back to the all-time high at $52.99.
After a close above $38.00, LINK will not face any credible resistance until the topside trend line at $49.55. It is closely followed by the May 10 high at $52.99, and investors should wait for a daily close above the high before committing further capital to the trade.
Bigger aspirations for Chainlink price point to the 161.8% Fibonacci extension of the current May decline at $64.02. It would be an 80% rally from today’s low and spot on with the rally that followed the April correction to the May 10 high.
Suppose today’s rebound accelerates into the close. In that case, LINK has the potential to close today with a bullish hammer candlestick pattern, adding to the confirmation process of a Chainlink price low and providing a stop-loss for the buy-the-dip investors.
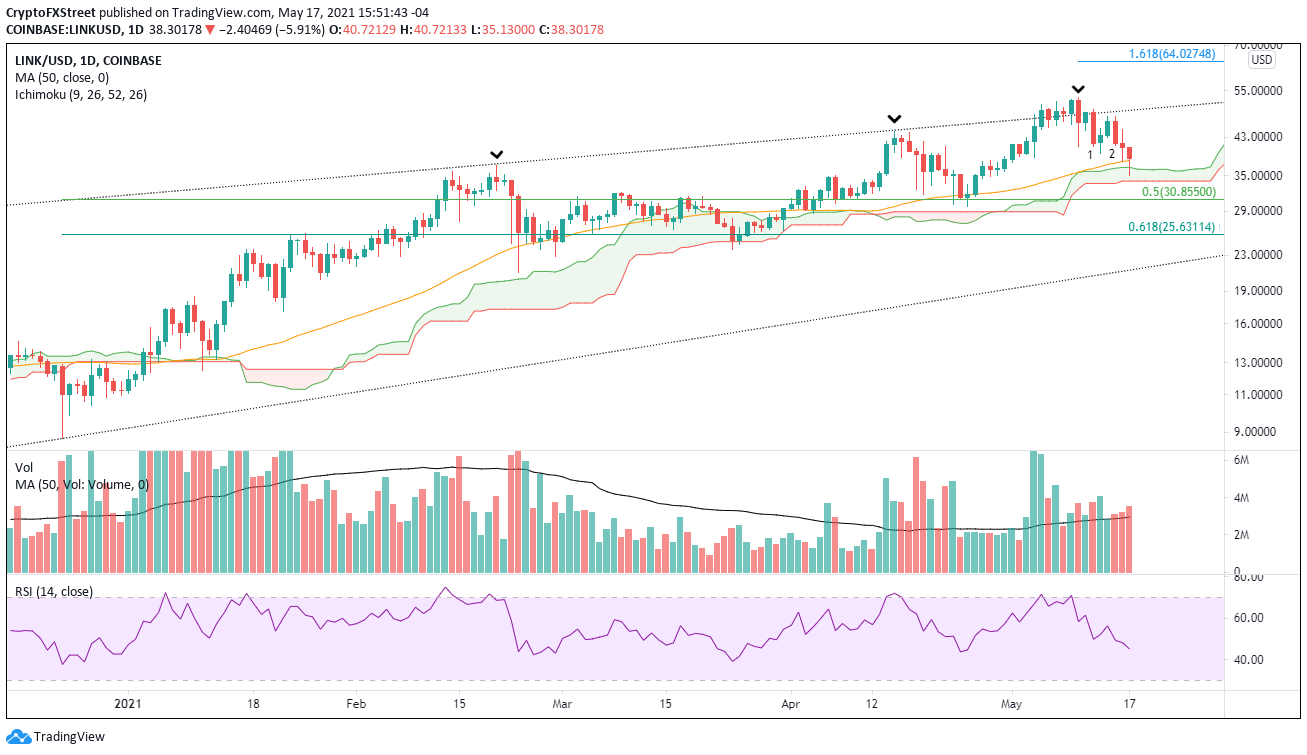
LINK/USD daily chart
The current selling pressure in the cryptocurrency market is a headwind for the realization of a bottom today. The support levels emerge at the lower range of the Ichimoku Cloud at $34.06 and then the 50% retracement of the major rally that began on December 23, 2020. It would take heavy selling pressure to push Chainlink price to the 61.8% retracement at $25.63.
Author

Sheldon McIntyre, CMT
Independent Analyst
Sheldon has 24 years of investment experience holding various positions in companies based in the United States and Chile. His core competencies include BRIC and G-10 equity markets, swing and position trading and technical analysis.


