Chainlink Price Analysis: LINK/USD bears threaten to retest the upside trend line
- LINK may be vulnerable to further losses as the price dropped below the daily SMA50.
- A sustainable recovery above $12.80 will mitigate the initial bearish pressure.
-637336005550289133.jpg)
Chainlink (LINK) has lived through one of the worst weeks in history. The token with the current market capitalization of $3.9 billion lost nearly 35% of its value in the last seven days and touched the area below $11.00 for the first time since the beginning of August. At the time of writing, LINK/USD is changing hands at $11.00, down over 10% on a day-to-day basis. The token's trading volume slumped to $1.3 billion from $1.7 billion on Friday, September 4.
LINK/USD: The technical picture
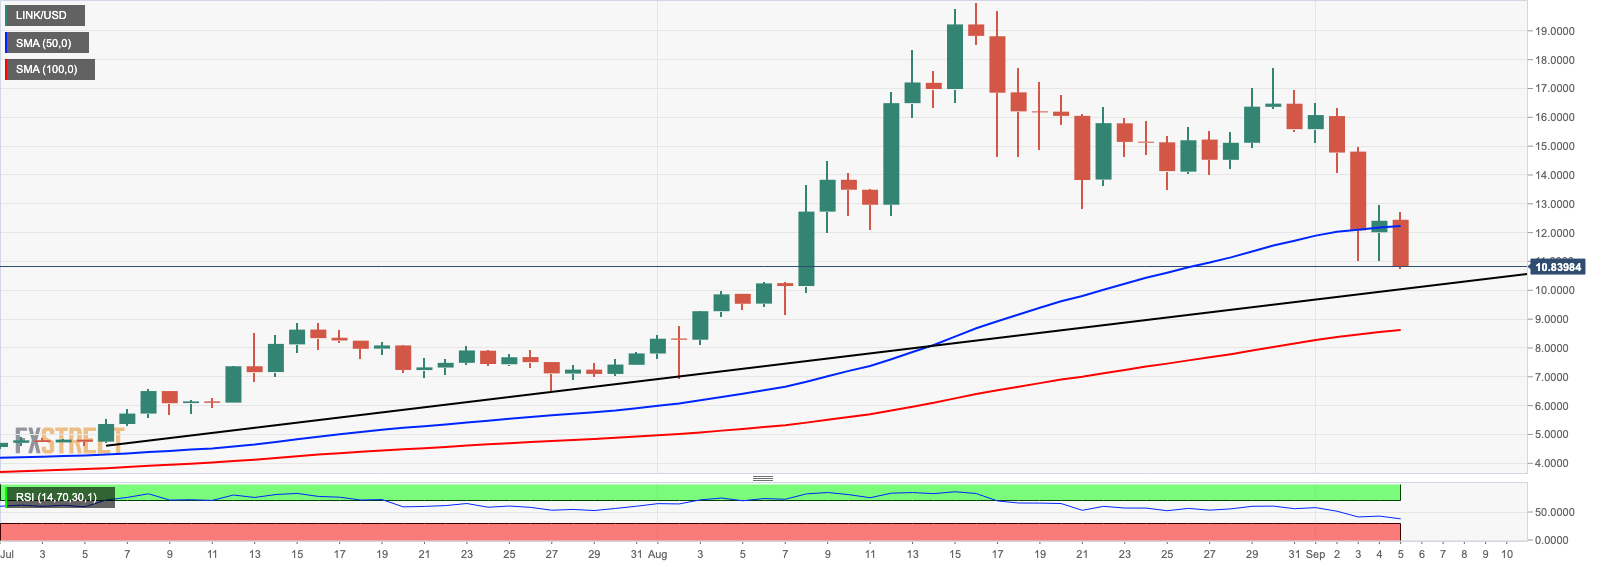
Technical signals imply that LINK's price has not bottomed yet. The token dropped below the daily SMA50 and may retest the support of $10 created by the upside trendline from July 6. This barrier should slow down the bears and create a pre-condition for an upside correction. However, once it is cleared, the sell-off may be extended towards $8.6 (the daily SMA100). A sustainable move below this area will signal that the bullish trend is over, and the price is ready to return to the range that dominated in the first half of 2020.
A move above the daily SMA50 (currently at $12.23) will mitigate the immediate bearish pressure and allow for a recovery towards $13.80-$14.00. This area served as a support at the end of August.
LINK/USD daily chart
The 4-hour chart's picture confirms the downside momentum of the coin with the local support at $10.00. The initial recovery attempts will be limited by the consolidation area on approach to $12.80. The critical resistance is created by a combination of the 4-hour SMA50 and SMA100 at $15.
LINK/USD 4-hour chart
-637349080372631409.png)
To conclude, LINK/USD is vulnerable to further losses with the support areas at $10 and $8.6. Meanwhile, a recovery above the resistance zone of $12.20-$12.80 will negate the immediate bearish scenario and allow for a move towards $15.00.
Author

Tanya Abrosimova
Independent Analyst


