Cardano price shows potential buying opportunity ahead of expected bullish surge
- Cardano price reacted off the daily pullback resistance at $0.455, signaling a short-term downtrend.
- Sideline investors can accumulate ADA at a support area extending between $0.363 and $0.349.
- A daily candlestick close below $0.317 would invalidate the bullish thesis.
Cardano (ADA) price is encountering resistance near the daily level at $0.455, indicating a short-term downturn. Investors waiting on the sidelines may consider accumulating ADA between $0.363 and $0.349, anticipating a subsequent rally in the coming days.
Cardano price could rally after retest of key support level
Cardano price broke above the descending trendline on July 12 and rallied 7% the following three days. After that, it was rejected by the daily resistance level at $0.445, and it declined 8.6%. It has attempted to break this resistance multiple times but has yet to do so. At the time of writing, it continues to retrace and trades 3% down at $0.393 on Thursday.
Investors looking for buying opportunities can do so at the daily bullish order block area between $0.363 and $0.349. A bullish order block area is where market participants, such as institutional traders, have previously placed buy orders. This order block area aligns with the trendline breakout point at $0.357, making it a key reversal zone.
Assuming Cardano's price bounces off the $0.357 level, it could rally 24% to retest its daily resistance at $0.445.
The Relative Strength Index (RSI) on the daily chart has briefly slipped below 50, its neutral level, while the Awesome Oscillator (AO) is on its way to doing the same. If bulls are indeed making a comeback, then both momentum indicators must maintain their positions above their respective mean levels. Such a development would add a tailwind to the recovery rally.
In case of an aggressive bullish outlook, if ADA closes above the $0.445 level, it could extend an additional rally by 26% to retest the 50% price retracement level (plotted from the March 14 high of $0.810 to the July 5 low of $0.318) at $0.564.
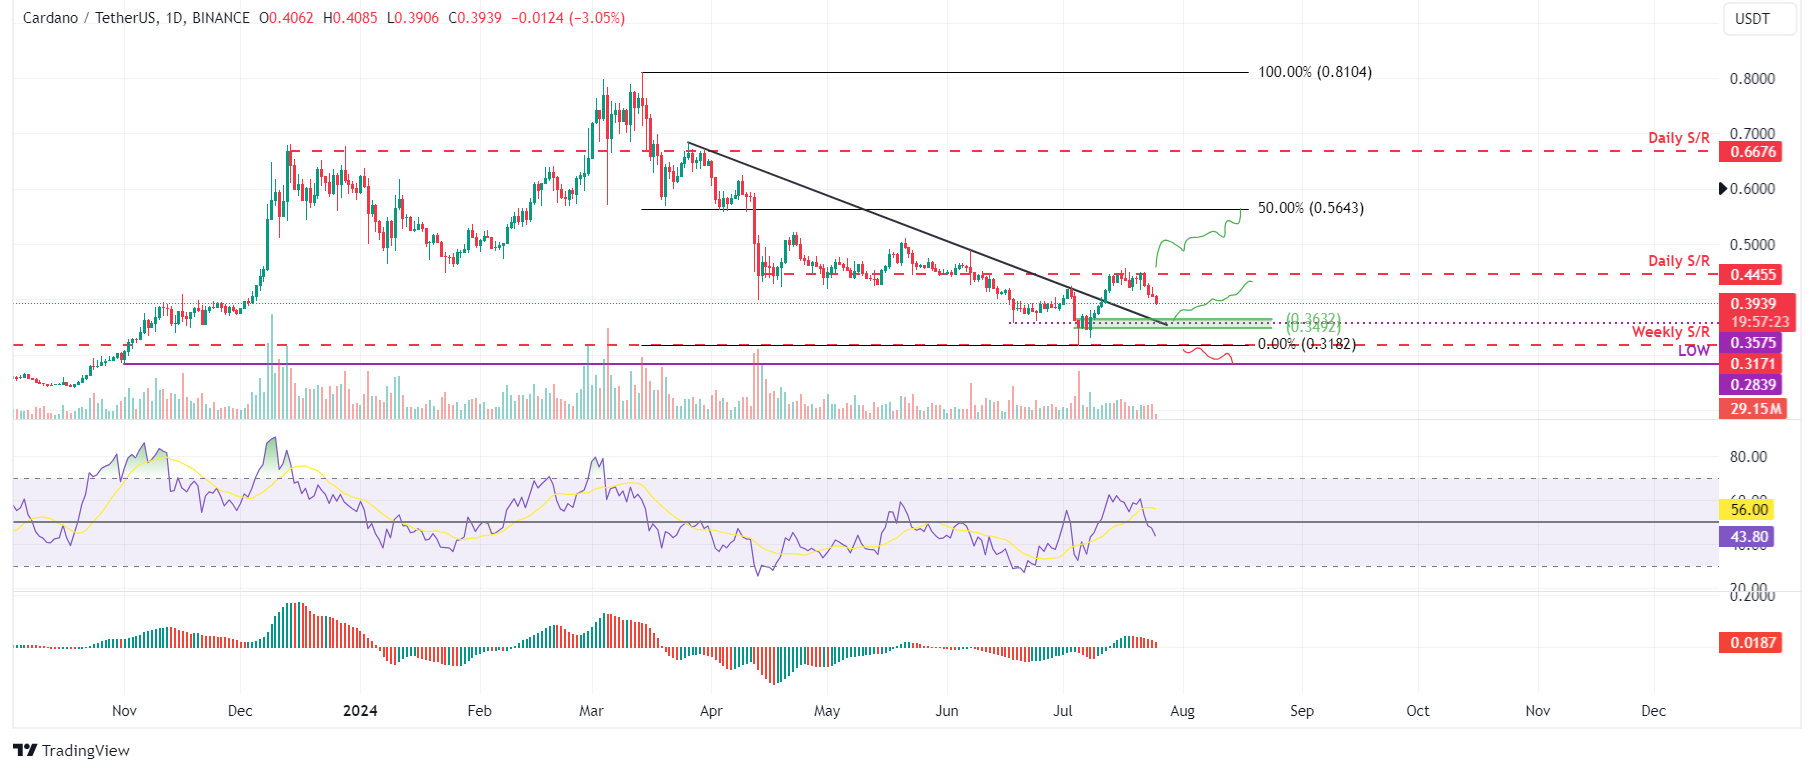
ADA/USDT daily chart
Based on IntoTheBlock's In/Out of the Money Around Price (IOMAP), nearly 161,130 addresses accumulated 1.91 billion ADA tokens at an average price of $0.385. These addresses bought Cardano tokens between $0.379 and $0.391, which makes it a key support zone.
Interestingly, the $0.379 to $0.391 zone mentioned from a technical analysis perspective coincides with the IOMAP findings, making this zone a key reversal area to watch.
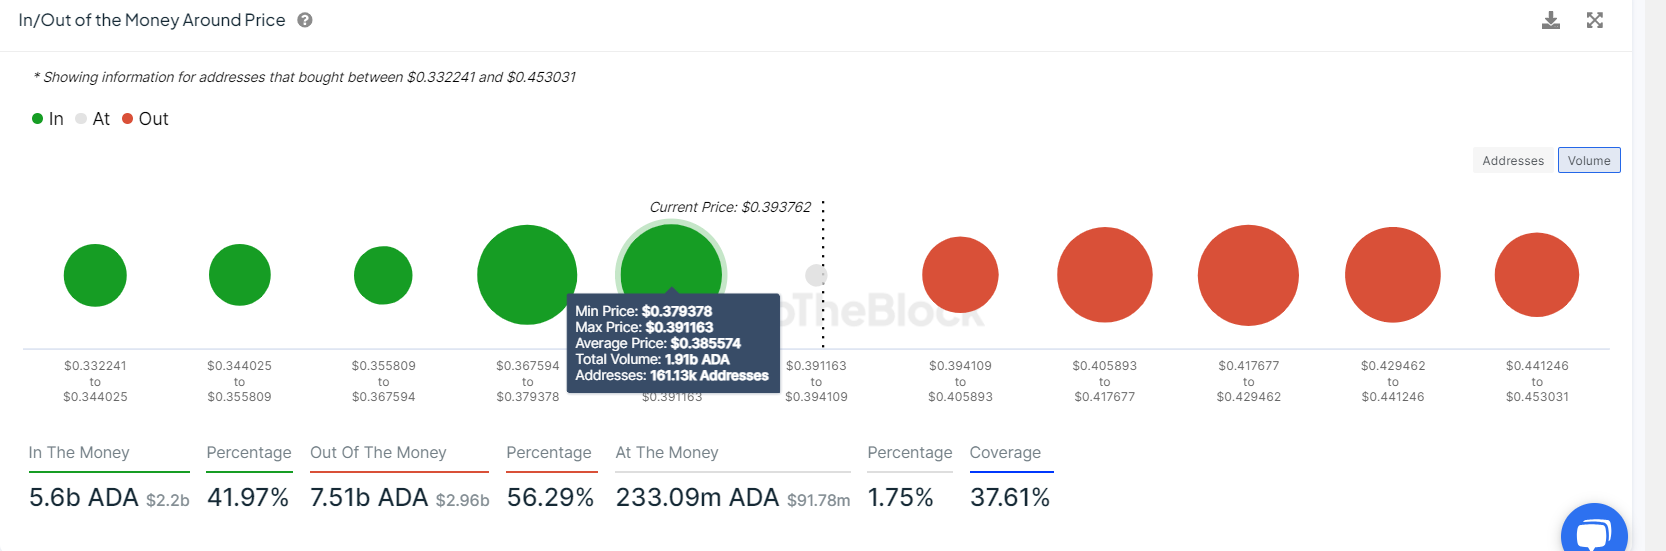
ADA IOMAP chart
Even though on-chain metrics and technical analysis point to a bullish outlook, if Cardano's price makes a daily candlestick close below $0.317, the bullish thesis would be invalidated by creating a lower low on the daily chart. This development could see ADA's price decline by 10% to retest its daily low of $0.283 from November 1, 2023.
Author

Manish Chhetri
FXStreet
Manish Chhetri is a crypto specialist with over four years of experience in the cryptocurrency industry.


