Cardano price set for a 10% rally upon a breakout above descending trendline
- Cardano price is testing its descending trendline, a breakout above it signals a potentially bullish move ahead.
- Technical analysis shows that ADA has formed a bullish divergence on a momentum indicator.
- A daily candlestick close below $0.317 would invalidate the bullish thesis.

Cardano's (ADA) price is revisiting its descending trendline, and a breakout above it signals a bullish move. ADA is supported by a bullish divergence observed in both the Relative Strength Index (RSI) and the Awesome Oscillator (AO), suggesting potential momentum for an upward rally.
Cardano price shows potential for a rally
Cardano price is retesting its descending trendline, which is drawn from joining multiple swing high levels from late March to early July.
If ADA breaks above the descending trendline, it could rise 10% to retest its daily resistance level of $0.426.
Additionally, the formation of a lower low in the daily chart on July 5 contrasts with the Relative Strength Index's (RSI) higher high during the same period. This development is termed a bullish divergence and often leads to the reversal of the trend or a short-term rally.
Moreover, if ADA closes above $0.426, it could extend the rally by an additional 31% to revisit its 50% price retracement between $0.318 and $0.810 at $0.564.
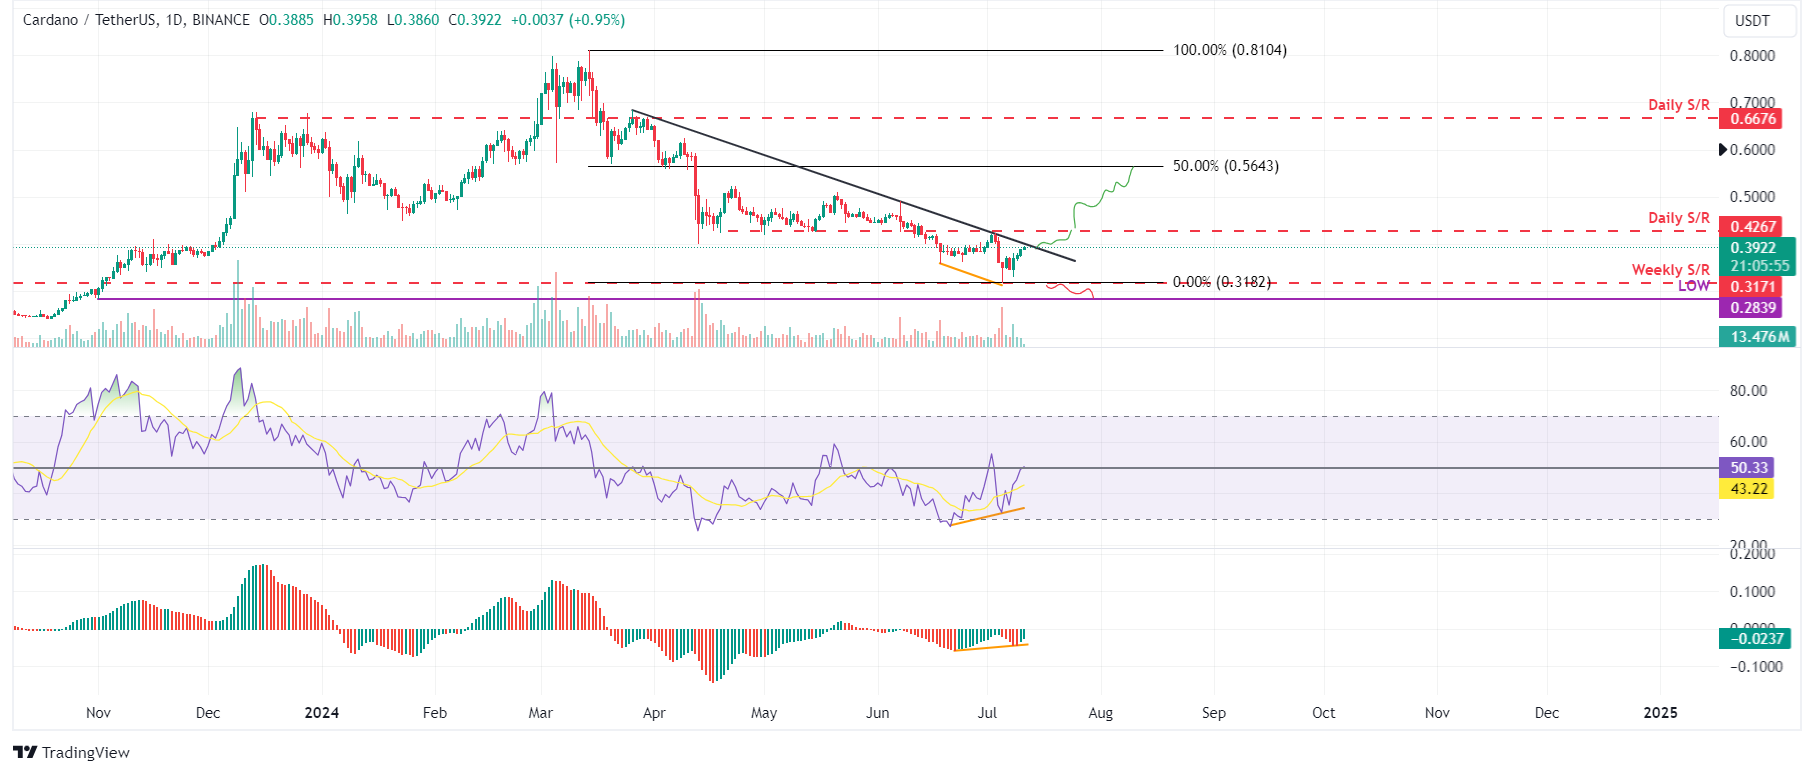
ADA/USDT daily chart
However, if ADA’s daily candlestick closes below $0.317 and establishes a lower low on the daily timeframe, it may signal a shift in market dynamics that favors bearish sentiment. Such a change could invalidate the bullish outlook, leading to a 10% crash in the Cardano price to the previous low of $0.283 on November 1, 2023.
Author

Manish Chhetri
FXStreet
Manish Chhetri is a crypto specialist with over four years of experience in the cryptocurrency industry.


