Cardano price presents a bullish buying opportunity as ADA nears a stable support floor [Video]
-
Cardano price has formed a bottom reversal pattern, suggesting a 14% rally is likely.
-
On-chain metrics suggest this run-up is likely but not sustainable.
-
A breakdown of the $1.20 support level will invalidate the bullish thesis.
![Cardano price presents a bullish buying opportunity as ADA nears a stable support floor [Video]](https://editorial.fxstreet.com/images/Markets/Currencies/Cryptocurrencies/Coins/Cardano/cardano.jpg)
Cardano price, like Solana, has set up a bottom reversal pattern, indicating a trend change is likely. A bounce off the immediate support floor will kick-start the bullish outlook for ADA and propel it to retest a crucial resistance barrier.
Cardano price to go against the wind
Cardano price tagged the $1.29 support level thrice since December 29, 2021, resulting in a triple bottom setup. This technical formation suggests that the downtrend is at an end and that a new uptrend is likely.
The journey toward North is plagued with resistance levels at $1.42, $1.47 and $1.50, indicating that ADA will face an arduous time. Despite the headwinds, ADA will likely rally 13% to retest the 50-day Simple Moving Average (SMA) at $1.47.
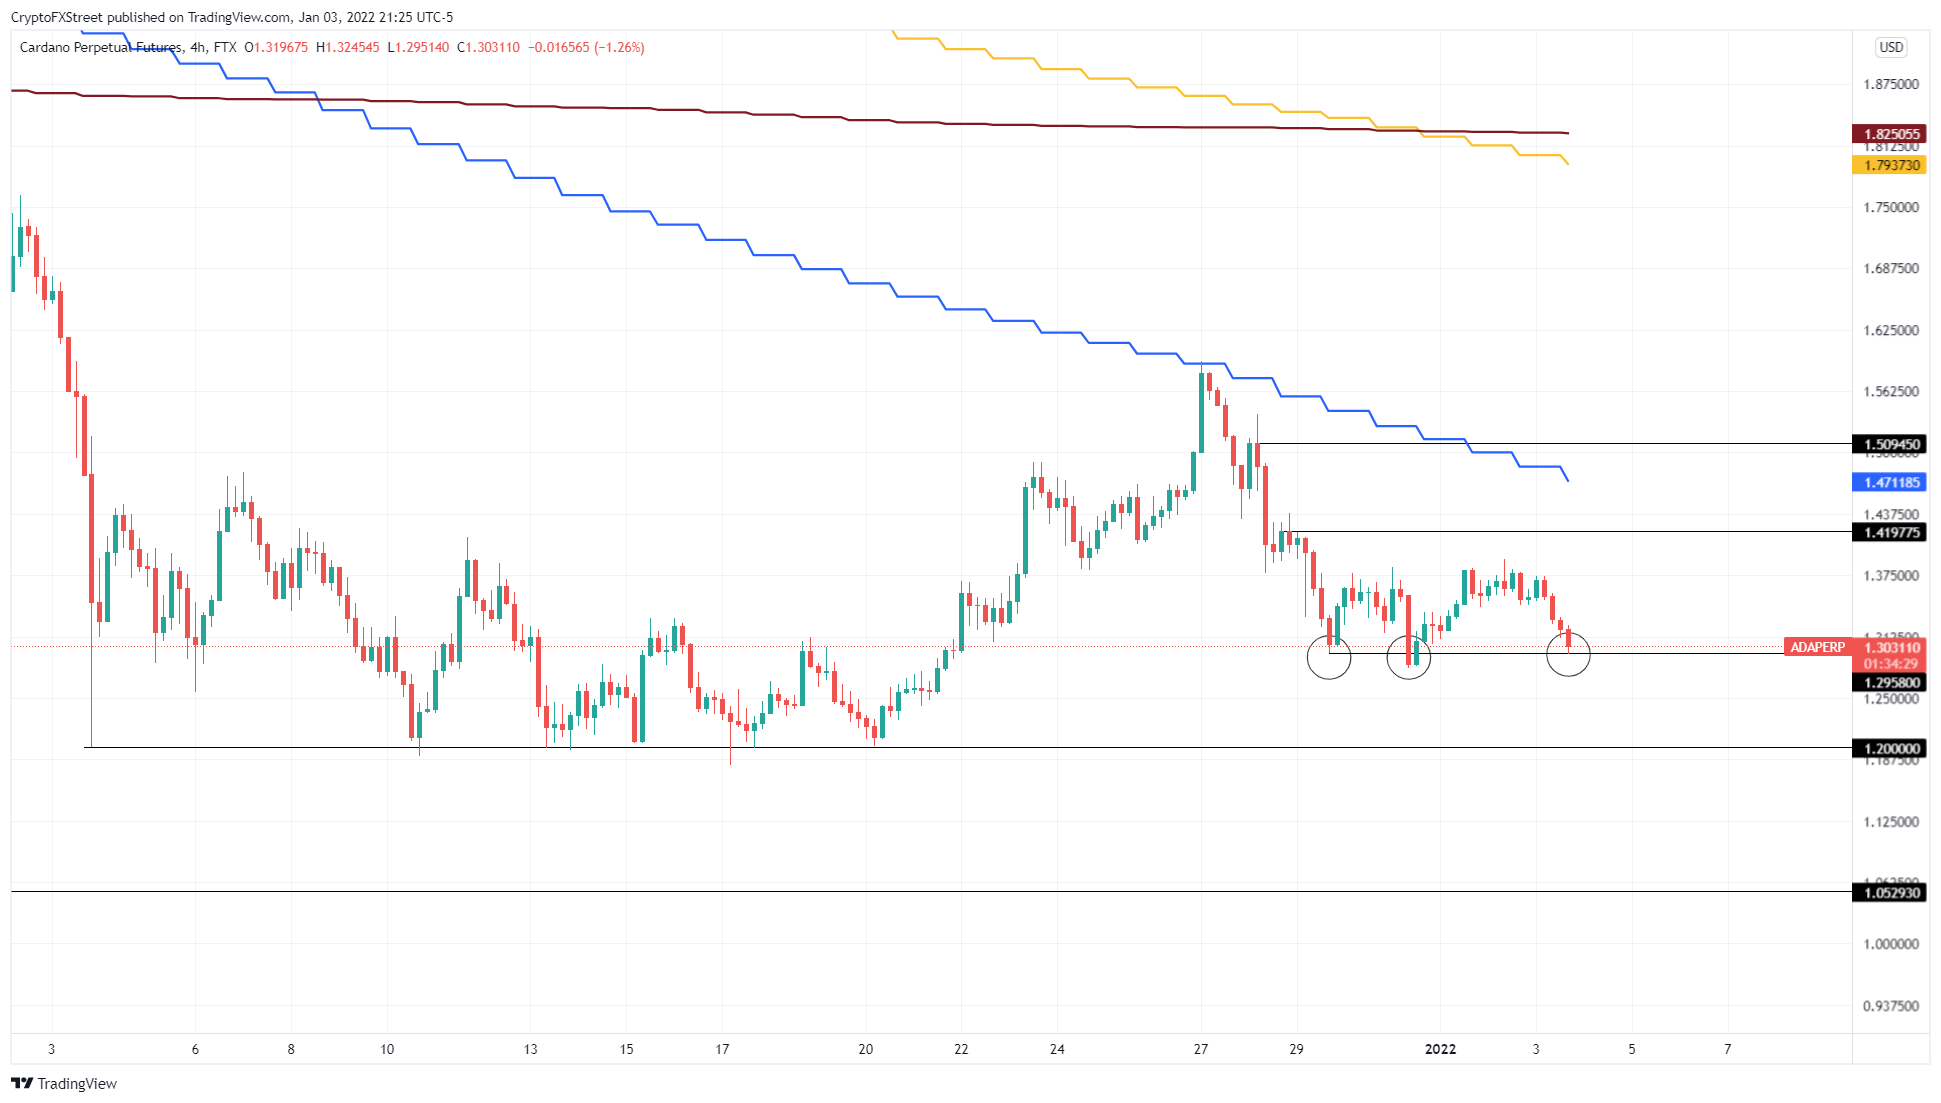
ADA/USDT 4-hour chart
Supporting this move to $1.47 is IntoTheBlock’s Global In/Out of the Money (GIOM) model, which shows a significant cluster of underwater investors present from $1.43 to $1.60. Here, roughly 408,000 addresses purchased 5.02 billion ADA and are “Out of the Money.”
While Cardano price can push through to these levels, it is unlikely to sustain here, as these holders might want to break even.
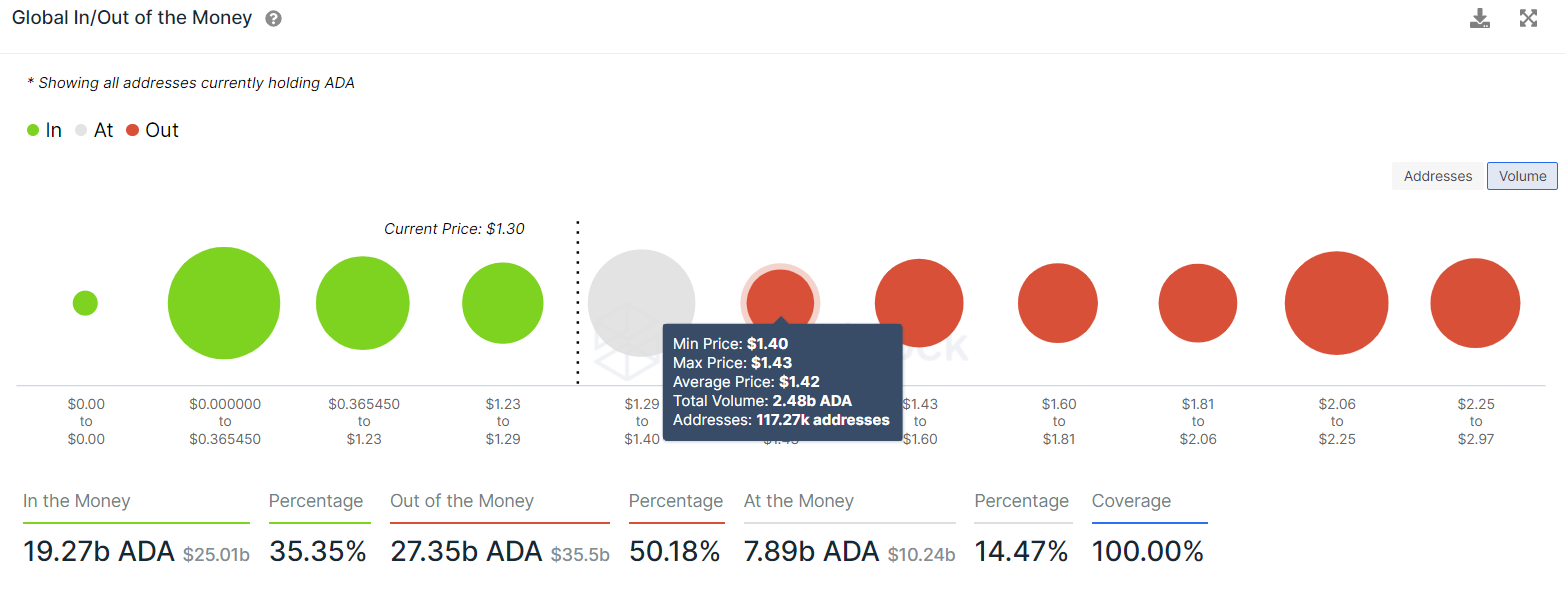
ADA GIOM
Further depicting the long-term bearish outlook for Cardano price is the steady decline in the number of large transactions worth $100,000 or more since November 1. These transfers, which serve as a proxy to institutional investors, have dropped from 6,630 on November 1 to 2,730 on January 3, representing a 58% drop, revealing the disinterest in ADA.
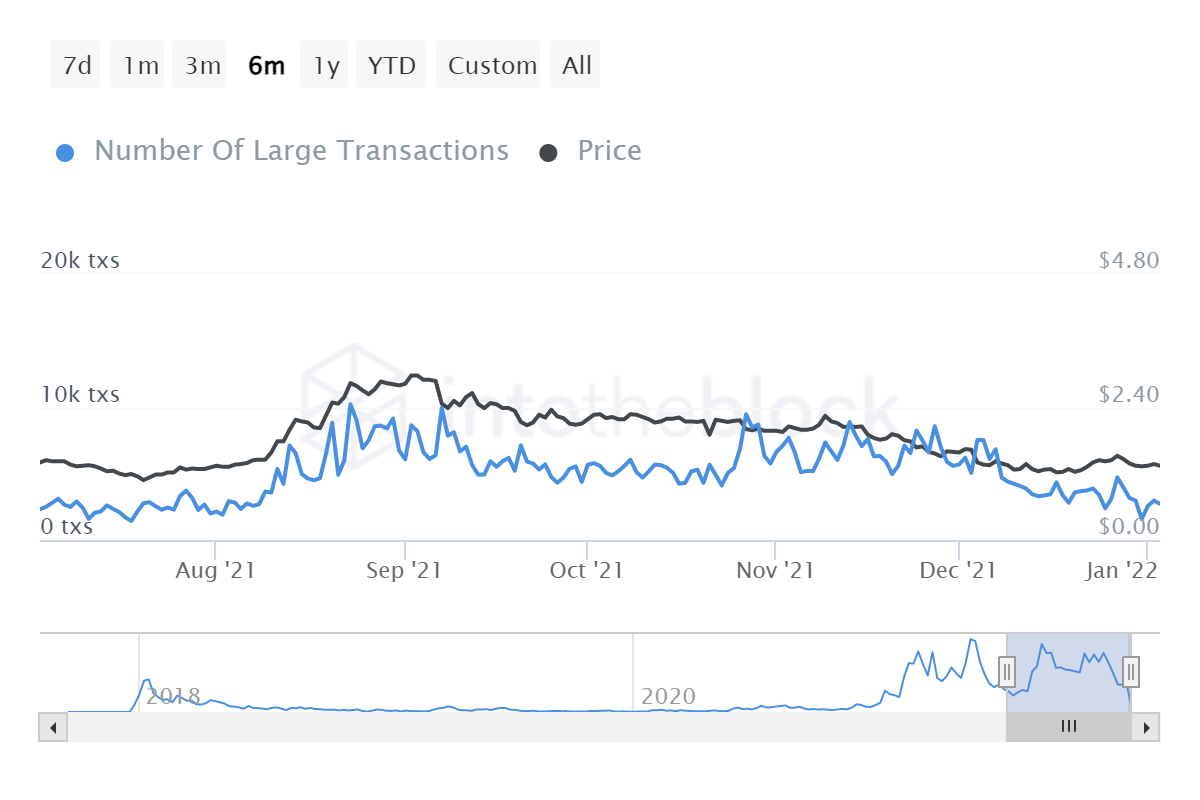
ADA large transactions
While things are looking up for Cardano price from a short-term perspective, the long-term outlook looks dreadful. A breakdown of the $1.20 support level will invalidate the bullish thesis and could trigger a 12% crash to the $1.05 support level.
Author

Akash Girimath
FXStreet
Akash Girimath is a Mechanical Engineer interested in the chaos of the financial markets. Trying to make sense of this convoluted yet fascinating space, he switched his engineering job to become a crypto reporter and analyst.



