Cardano Price Prediction: ADA needs to hold $1.39 or risks a dramatic decline
- Cardano price is building a multi-week symmetrical triangle, refining structure with the recent market volatility.
- Intersection of the 200 twelve-hour simple moving average (SMA) and 2018 high provide explicit support for any weakness.
- ADA daily Relative Strength Index (RSI) is neutrally positioned, offering pattern resolution room to extend.

Cardano price illustrates a symmetrical triangle on the 12-hour chart with a clear but significant measured move of 50%, putting the May 19 low or the all-time high in the crosshairs depending on the resolution direction. However, a tempered outcome of 30-40% is more consistent with the support and resistance levels. For now, the governing ADA outlook is neutral.
Cardano price searches for resolution in a period of uncertainty
ADA is the 5th largest cryptocurrency with a market capitalization of $50 billion, sitting between Binance Coin and Dogecoin.
Almost a month ago, Cardano price topped and fell 60% into the May 19 low. It was a staggering development for the high-flying cryptocurrency, but it also marked the beginning of a new ADA price structure forming through these days and weeks of market gyrations.
ADA volume during the pattern development has remained predominantly below average with a mild downslope, consistent with the volume profile of a constructive symmetrical triangle pattern.
The confluence of the 200 twelve-hour simple moving average with the 2018 high at $1.39 does present a significant obstacle to a downward resolution of the Cardano price triangle.
A daily close below the $1.39 level will provide the initial signal that the Cardano price triangle is resolving to the downside. A close below the May 29 low of $1.32 will be the confirmation and should prepare ADA investors for a test of the May 23 low at $1.04.
Aggressive selling could carry Cardano price to the convergence of the May low with the 200-day SMA at $0.91, resulting in a 38% decline from the triangle’s lower trend line.
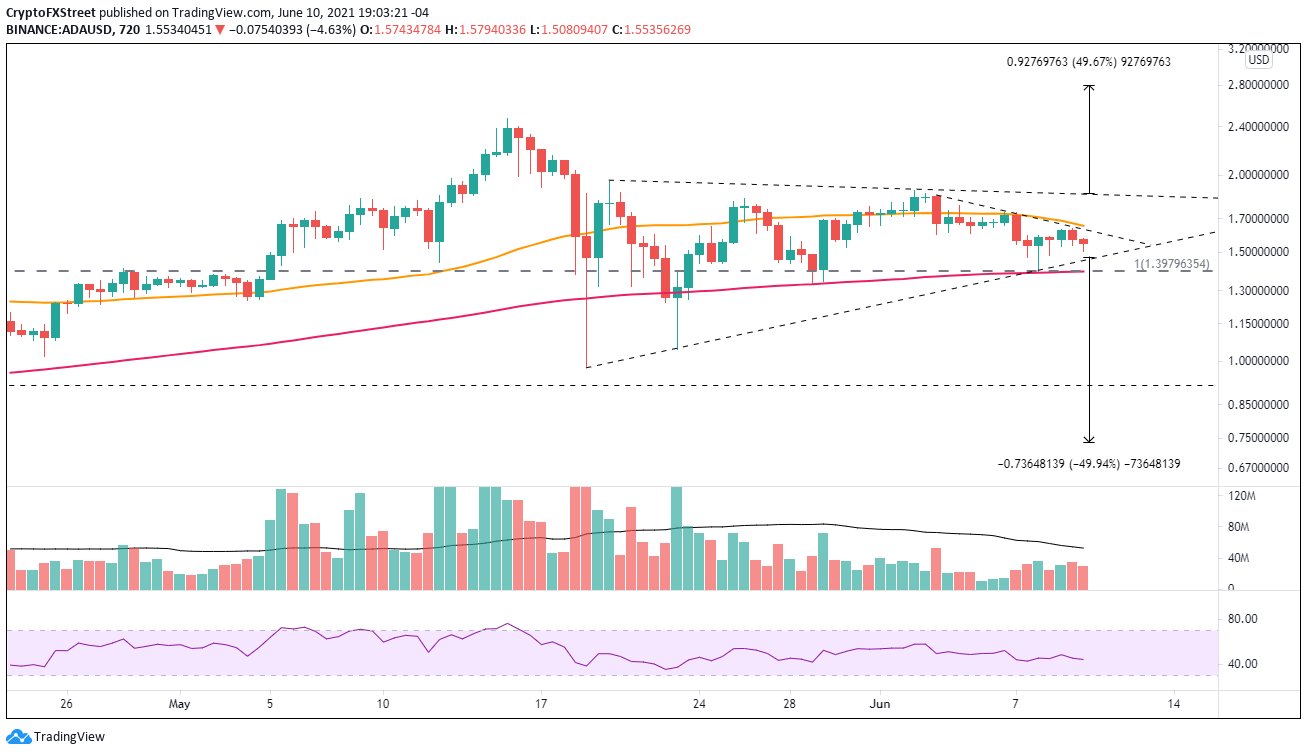
ADA/USD 12-hour chart
A close above the 50 twelve-hour SMA at $1.65 on a 12-hour chart will encourage the swift return of a strong bid for Cardano price, lifting it to the triangle’s upper trend line at $1.86. A daily close above the upper trend line should transform into a rally to the all-time high at $2.51, returning 34% for keen ADA investors.
A clear breakout or breakdown will shift the neutral Cardano price outlook for the symmetrical triangle. For now, market operators are best served to swing trade the gyrations using the clear support and resistance levels labeled on the chart.
Author

Sheldon McIntyre, CMT
Independent Analyst
Sheldon has 24 years of investment experience holding various positions in companies based in the United States and Chile. His core competencies include BRIC and G-10 equity markets, swing and position trading and technical analysis.


