Cardano Price Forecast: ADA demands caution as 25% decline looms
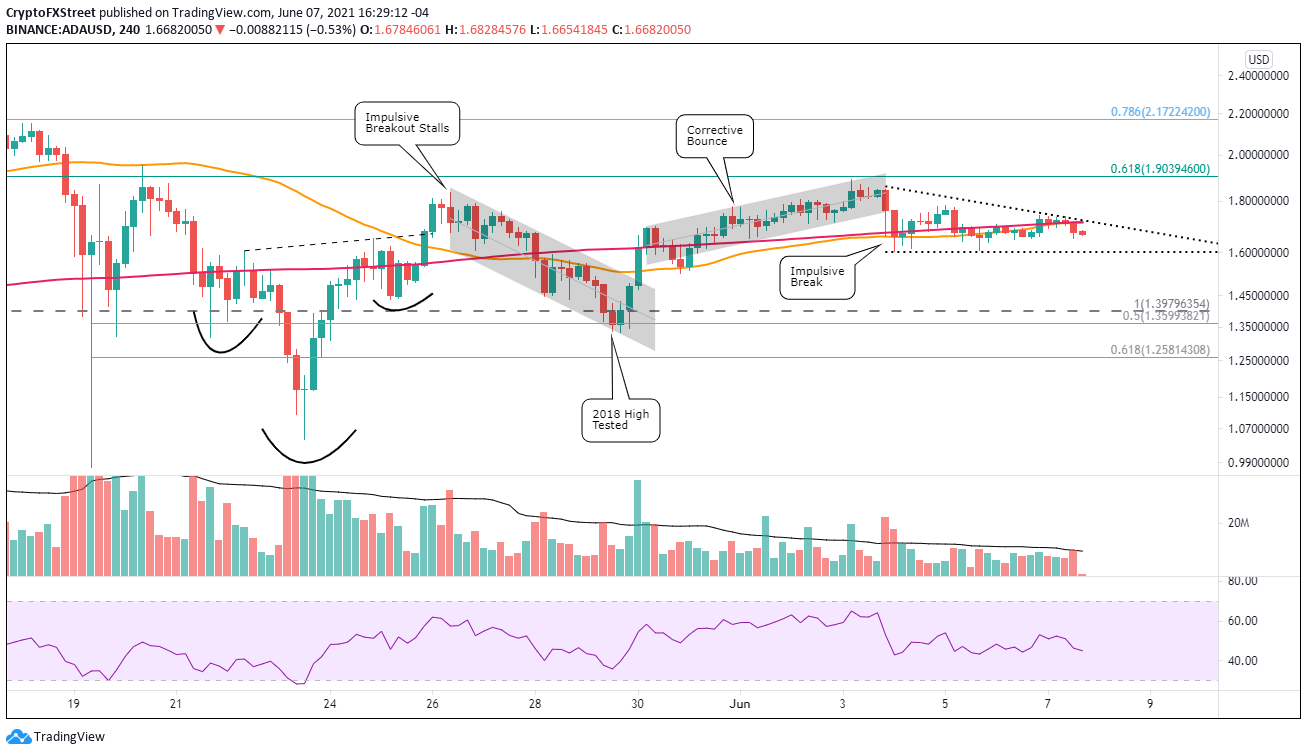
- Cardano price pattern transforms from ascending channel to descending triangle on the four-hour chart.
- Golden Cross does not materialize as fast-moving average fails to cross above the slow-moving average.
- 61.8% Fibonacci retracement of ADA May correction resists advance, like on May 20.

Cardano price defines a descending triangle on the four-hour chart with the 50 four-hour and 200 four-hour simple moving averages (SMA) serving as magnets. The lack of impulsiveness after May 26 has now positioned the green token at risk for another pullback if the triangle fails to hold selling pressure.
Cardano price with a fascinating story, but fails to gain traction after technical bounce
To review, Cardano price released from an inverse head-and-shoulders pattern on the four-hour chart on May 25. Still, it quickly faded under the dominant weakness in the cryptocurrency complex, thereby cutting below the right shoulder on May 29.
After the failure of the inverse head-and-shoulders pattern, the pullback evolved into a descending channel, pulling Cardano price below the absolutely critical 2018 high at $1.39. Initially, a blow for a developing leader, ADA rallied through the channel’s upper trend line and above the tactically important 200 four-hour SMA on May 30.
Again, after a brief burst, Cardano price transferred to a corrective ascending channel, lifting ADA 40% from the May 29 low to the 61.8% retracement of the May correction at $1.90.
Since June 3, Cardano price has shaped a descending triangle with the demand line (lower trend line) sitting at $1.60. ADA currently trades below the intersection of the 50 four-hour and 200 four-hour moving averages at $1.71.
A failure to generate price traction these weeks is not unique to Cardano price. Still, the culmination of the minor patterns described above leaves ADA vulnerable to another test of the 2018 high in the immediate term and potentially the confluence of the 50% retracement of the May-June rally at $1.35 with the May 29 low at $1.33.
A test of the 61.8% retracement of the May-June rally at $1.25 is also a consideration for a decline low, representing a decline of 25% from the current price.
ADA/USD 4-hour chart
Suppose Cardano price takes on the personality of impulsiveness and trades above the June 3 high and 61.8% retracement at $1.90 on a closing basis. In that case, ADA only needs to overcome the 78.6% retracement at $2.17 to finalize the rally to the all-time high at $2.51.
ADA is a compelling project that trades less than 50% from the all-time high at the time of writing, but the transformation of Cardano price since the inverse head-and-shoulders breakout has not reflected the project potential. Instead, it has been suffocated by the weight of the broader market uncertainty, orchestrating a series of minor technical patterns that award a mixed prognosis for the immediate future.
For now, Cardano’s favorite word is caution.
Author

Sheldon McIntyre, CMT
Independent Analyst
Sheldon has 24 years of investment experience holding various positions in companies based in the United States and Chile. His core competencies include BRIC and G-10 equity markets, swing and position trading and technical analysis.


