|

Cardano Price Prediction: ADA in no-trade zone while momentum builds for high volatility

  • Cardano price is contained inside a symmetrical triangle pattern on the 12-hour chart.
  • The digital asset trades right in the middle of the pattern awaiting clarity.
  • It seems that bears have taken control of the short-term trend.

Cardano attempted to crack the 2020-high of $0.182 on December 17, but bulls came off short and only managed to push ADA to $0.176 before a violent sell-off in the next four days. It seems that bears are pushing Cardano price towards $0.14. 

Cardano price awaits a clear breakout

ADA has formed a symmetrical triangle pattern on the 12-hour chart and it’s trading at $0.152 at the time of writing. Bulls have lost the 50-SMA support level and it seems that the next bearish price target is the lower trendline of the pattern at $0.14. 

ada price

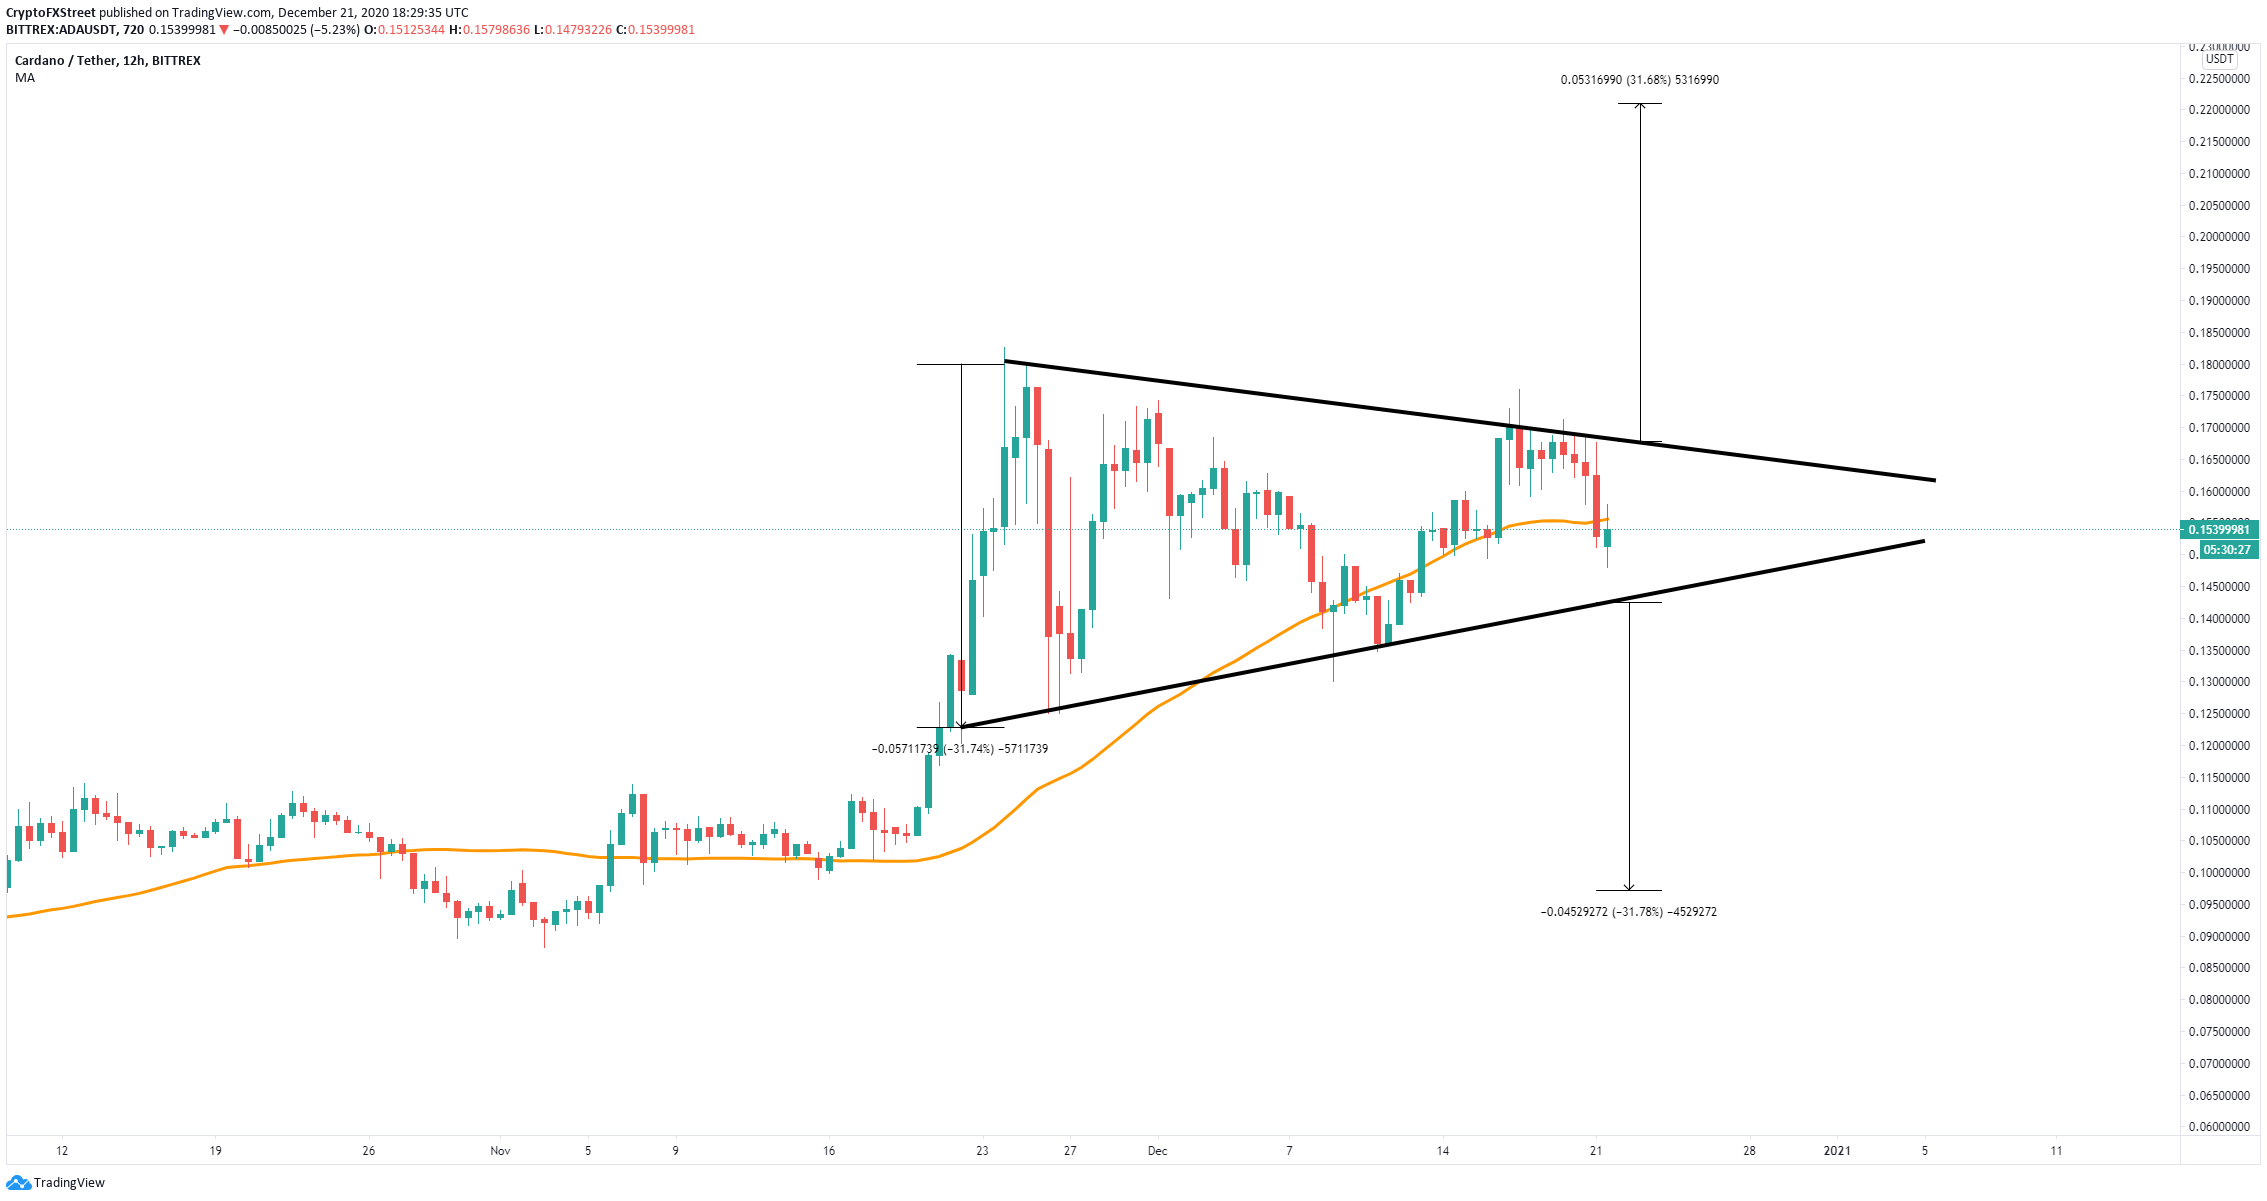
ADA/USD 12-hour chart

However, bears would still need to crack the critical support level at $0.14 in order to see a clear breakdown. Using the height of the pattern as a reference point, we can estimate the most likely price target to be at $0.1.
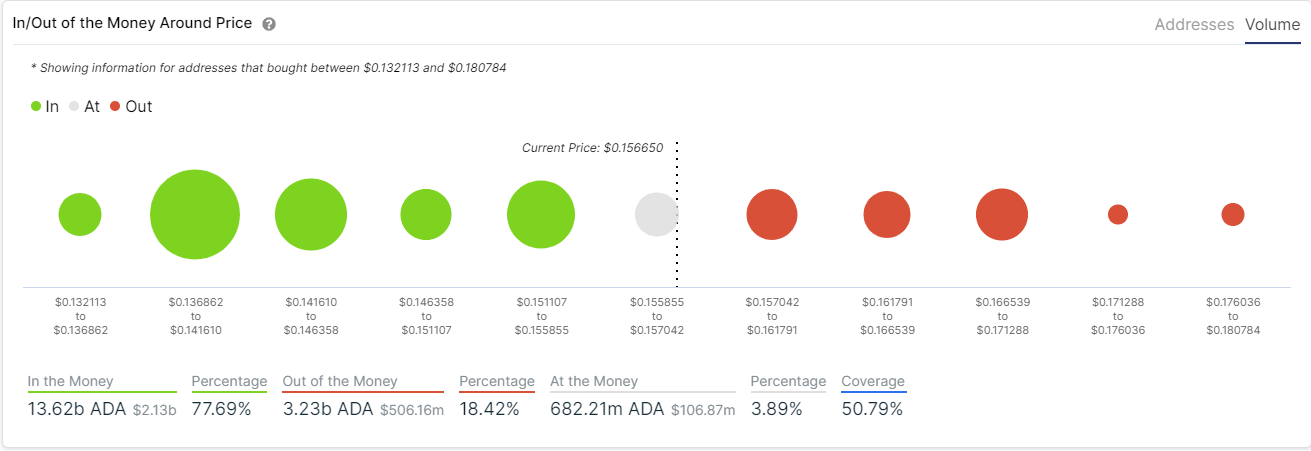
ada price

ADA IOMAP chart

The In/Out of the Money Around Price (IOMAP) chart shows very little resistance to the upside. It seems that a breakout above the area between $0.157 and $0.162 can easily drive Cardano price towards $0.18. 

That breakout would also represent cracking the symmetrical triangle pattern with a price target of $0.22 in the long-term.

Author

Lorenzo Stroe

Lorenzo Stroe

Independent Analyst

Lorenzo is an experienced Technical Analyst and Content Writer who has been working in the cryptocurrency industry since 2012. He also has a passion for trading.

More from Lorenzo Stroe
Share:

Editor's Picks

Crypto Today: Bitcoin at $60,000, Ethereum at $1,500, and XRP at $1 face a make-or-break test

Bitcoin (BTC), Ethereum (ETH), and Ripple (XRP) are trading in the red on Friday after three consecutive days of losses, testing their respective make-or-break support levels.

Bitcoin Weekly Forecast: BTC hits 20-month low, will the pain continue?

Bitcoin recovers slightly, trading at $66,000 on Friday after reaching a new yearly low of $58,115 earlier this week, its lowest level since October 2024. Institutional selling intensified as spot ETFs recorded $1.35 billion in net outflows through Thursday.

XRP clings to $1 as long liquidations deepen bearish trend

Ripple trades near the key psychological support level of $1 at the time of writing on Friday after losing more than 8% so far this week. CoinGlass liquidation data shows that over 97% XRP long positions were wiped out over the past 24 hours.

Pi Network Price Forecast: Minor recovery amid market crash fuels short-term hope

Pi Network price records a mild 3% recovery at press time on Friday, shaping a rebound from a broken descending trendline. The declining trend in trading volume has stabilized around $10 million this week, supporting the possibility of an extended recovery as selling pressure wanes.

Bitcoin: BTC hits 20-month low, will the pain continue?
Bitcoin (BTC) recovers slightly, trading at $66,000 on Friday after reaching a new yearly low of $58,115 earlier this week, its lowest level since October 2024. Institutional selling intensified as spot Exchange Traded Funds (ETFs) recorded $1.35 billion in net outflows through Thursday.