|

Cardano Price Forecast: ADA price forms deadly pattern, suggesting further correction to $0.08

  • The daily price charted the bearish engulfing pattern and has broken below the 200-day SMA ($0.0943).
  • The IOMAP shows a moderate support wall at $0.082 on the downside.

After finding support at the $0.076 support wall, the price bounced up to $0.11 between September 23 and October 22. Since then, the price has dropped to $0.091. This Monday, the ADA daily price charted the bearish engulfing pattern and broke below the 200-day SMA ($0.0943). A further spike in Cardano's selling pressure could see it drop to $0.08 or $0.07.
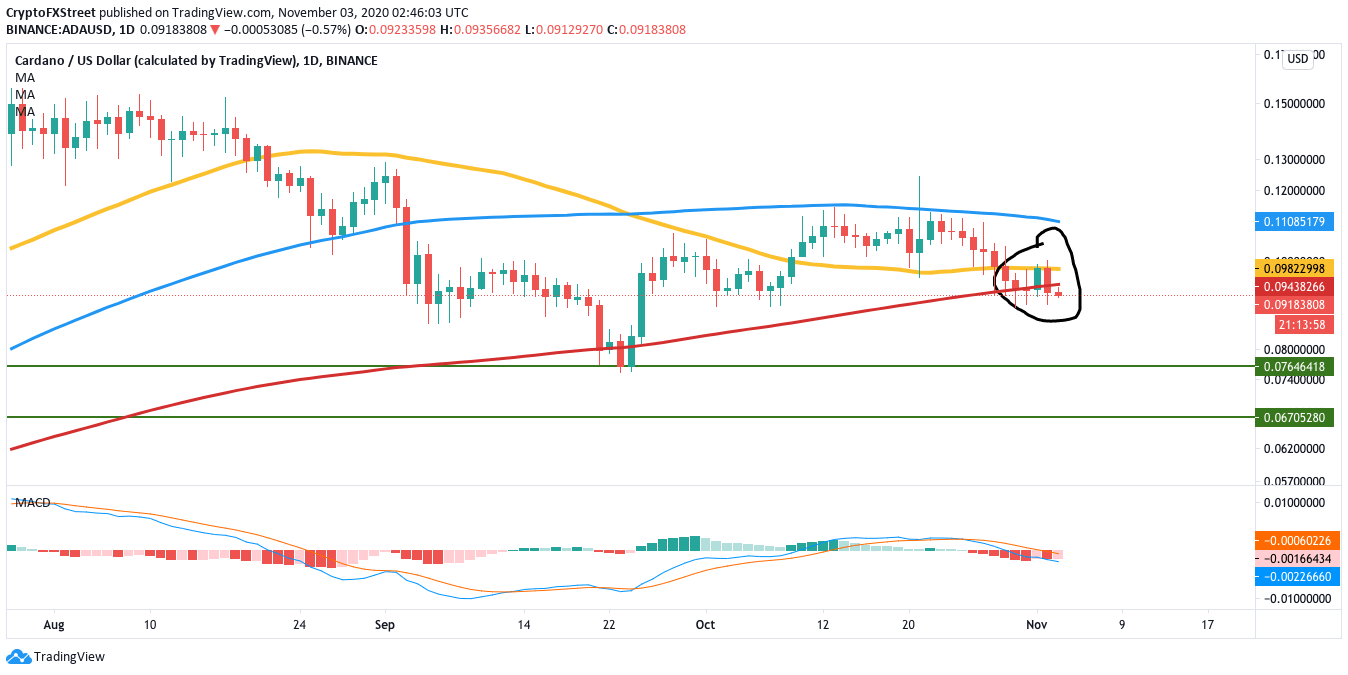
ADAUSD daily chart

ADA/USD daily chart

IntoTheBlock’s In/Out of the Money Around Price (IOMAP) helps us visualize strong support and resistance areas. As per the IOMAP, there is a lack of healthy support walls on the downside. The only notable support lies at the $0.082. If the bears manage to take the price below that, it will go down to the $0.076 support line.
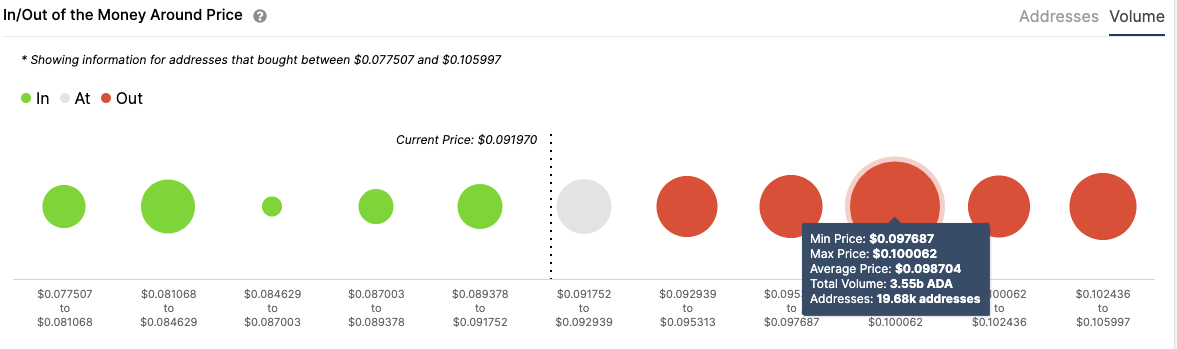
fxsoriginal

ADA IOMAP

Can the bulls flip the situation around?

The bulls can change the narrative by regaining the 50-day SMA ($0.098) and using it as support to aim for the 100-day SMA ($0.11). However, the IOMAP shows us that the strongest resistance barrier lies at the 50-day SMA. This barrier looks strong enough to absorb a tremendous amount of buying pressure.

Key price levels to watch

ADA bears will aim to break below the $0.082 support wall and go down to the $0.076 line.

The bulls will aim to conquer the 50-day SMA ($0.098). However, this barrier is solid and will require a lot of work to flip around.
 

Author

Rajarshi Mitra

Rajarshi Mitra

Independent Analyst

Rajarshi entered the blockchain space in 2016. He is a blockchain researcher who has worked for Blockgeeks and has done research work for several ICOs. He gets regularly invited to give talks on the blockchain technology and cryptocurrencies.

More from Rajarshi Mitra
Share:

Editor's Picks

Top 3 Price Prediction: Bitcoin, Ethereum, Ripple deepen sell-off as bears take control of momentum

Bitcoin, Ethereum, and Ripple continued their corrections on Friday, posting weekly losses of nearly 6%, 3%, and 5%, respectively. BTC is nearing the November lows at $80,000, while ETH slips below $2,800 amid increasing downside pressure.

Shiba Inu Price Forecast: SHIB extends losses as whale selling intensifies bearish momentum

Shiba Inu (SHIB) price slips below $0.0000077 on Thursday after correcting the previous day. Bearish sentiment is further strengthened as holders offload SHIB, increasing selling pressure and reducing Open Interest in the derivatives market.

Top Crypto Losers: Worldcoin, Chiliz, Hyperliquid lead losses as market bleeds $1.75 billion

Worldcoin , Chiliz , and Hyperliquid posted heavy losses over the last 24 hours as Bitcoin dropped below $82,000 on Friday, triggering a $1.75 billion wipeout and mirroring the bearish tremors in the US stock market.

Fidelity unveils FIDD stablecoin, set to launch in coming weeks

Fidelity Investments announced that it will launch its first stablecoin, the Fidelity Digital Dollar (FIDD), making it one of the first large traditional firms in the US to do so.

Bitcoin Price Annual Forecast: BTC holds long-term bullish structure heading into 2026

Bitcoin (BTC) is wrapping up 2025 as one of its most eventful years, defined by unprecedented institutional participation, major regulatory developments, and extreme price volatility.

Bitcoin: BTC correction deepens as Fed stance, US-Iran risks, mining disruptions weigh

Bitcoin (BTC) price extends correction, trading below $82,000 after sliding more than 5% so far this week. The bearish price action in BTC was fueled by fading institutional demand, as evidenced by spot Exchange-Traded Funds (ETFs), which recorded $978 million in inflows through Thursday.