Cardano Price Forecast: ADA breakthrough lacks conviction, time for a 15% retracement
- Cardano price logs a weekly close above the demanding resistance of the 2018 high.
- 10-week simple moving average (SMA) emerges as new resistance at $1.58.
- A weak ADA volume profile points to a lack of buyers versus a lack of sellers.

Cardano price has oscillated around the 2018 high for much of 2021, either striking resistance at the level or support. Thus, the weekly close above $1.40 last week was a bullish departure from the daily rejections that dominated trading in the last week of June. Nevertheless, the lack of volume underpinning the bullish event combined with no follow-through this week, and a notable layer of resistance around $1.55 may project a quick reversal of fortune for ADA.
Cardano price standoff resolves higher, creates a false sense of confidence
Cardano price, unlike many altcoins, closed the 2Q with a 16% gain. However, the digital asset failed to close the quarter above the 2018 ADA high of $1.40 for the second straight quarter, only reinforcing the importance of the price level.
Last week, Cardano price recaptured the 2018 high with a weekly close above $1.40, and as a result, ADA narratives are bullish for the first time in over a month. Nevertheless, the event was not directed by a newfound interest in the altcoin as volume closed at 25% of the 50-week average.
This week Cardano price action has confirmed the underwhelming interest in ADA with no follow-through, highlighting that there is no stampede to join the potential new rally despite the technical breakthrough. To be blunt, FOMO has not descended on cryptocurrency.
Adding pressure to the bullish Cardano price narrative is a new layer of resistance framed by the 10-week SMA at $1.58 and the price congestion around $1.55 that extends back to February. Continuing the rally into the tactically important moving average would yield just a 12% gain from the current price.
With new, credible resistance pressing on Cardano price coupled with the absence of interest above $1.40, the outlook for ADA remains neutral. A drop below the 2018 high would not be a surprise, and under the current circumstances, it is anticipated.
A level of support to pinpoint is $1.20, which corresponds to the June 27 and July 1 lows and represents a 14.5% decline from the current price. Additional ADA weakness will not be interrupted until the psychologically important $1.00, logging a 30% decline.
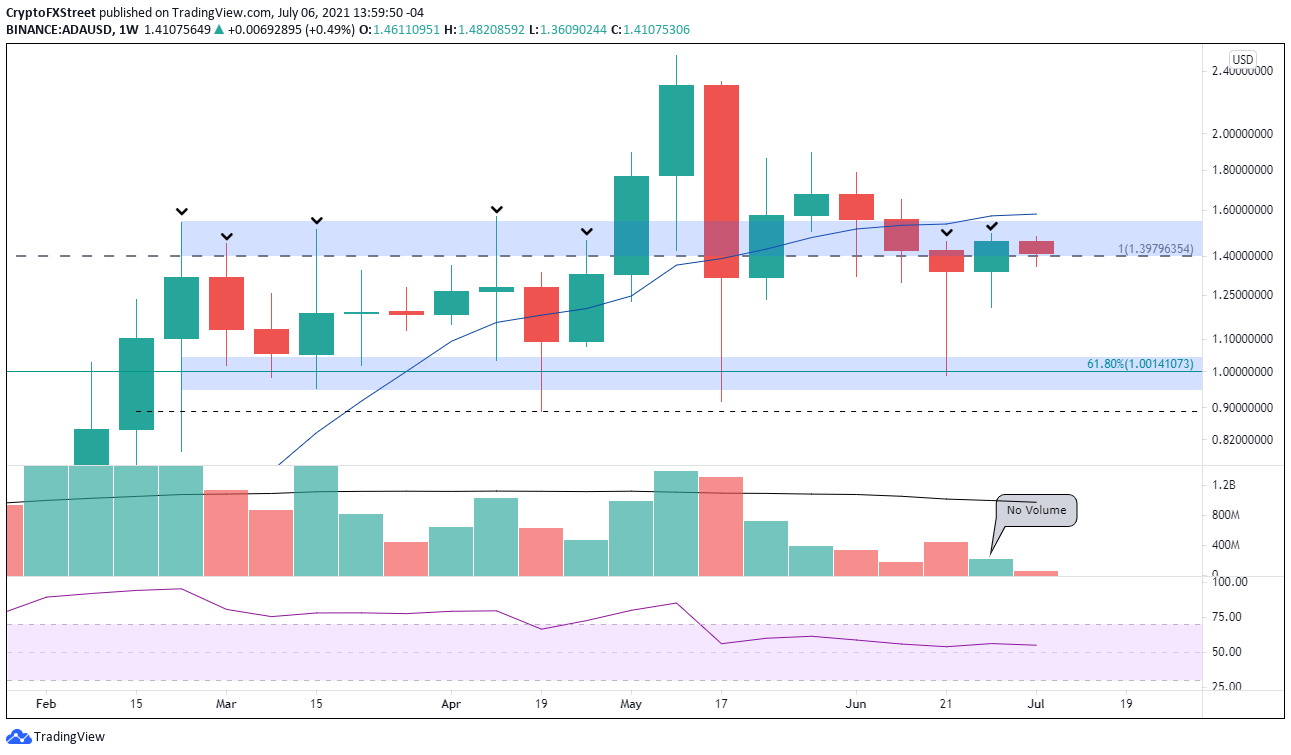
ADA/USD weekly chart
A weekly close above the 10-week SMA would alter the price structure and offer ADA investors a new, sustainable investment opportunity.
Author

Sheldon McIntyre, CMT
Independent Analyst
Sheldon has 24 years of investment experience holding various positions in companies based in the United States and Chile. His core competencies include BRIC and G-10 equity markets, swing and position trading and technical analysis.



