Cardano price could be facing a steeper correction, suggests technicals
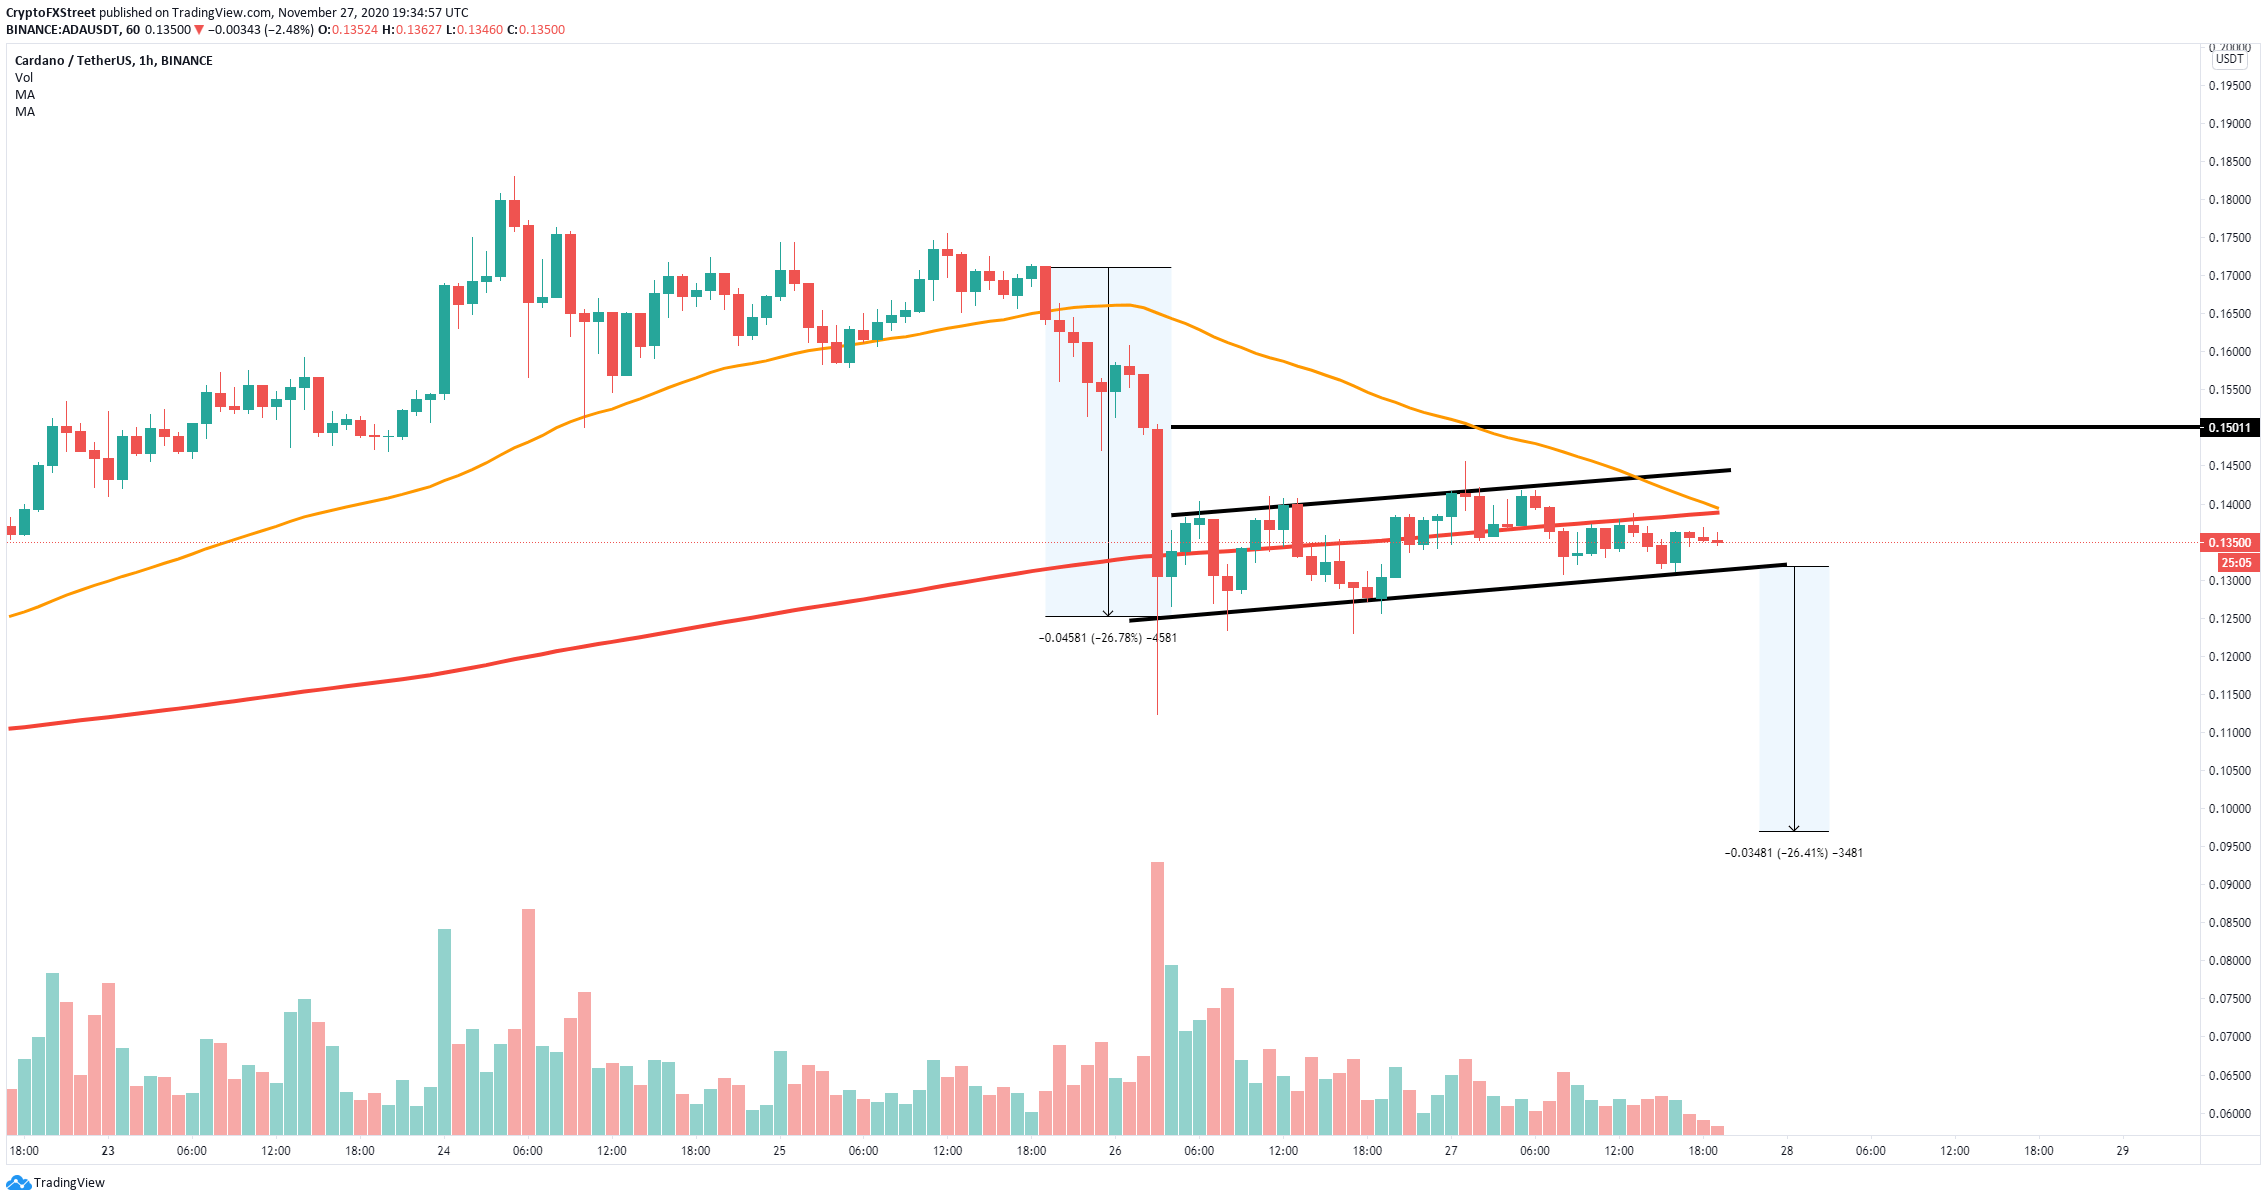
- Cardano price seems to be bounded inside a bear flag on the 1-hour chart.
- The digital asset has attempted to rebound from the low at $0.112.

Cardano plummeted by 39% in the past three days after the entire cryptocurrency market collapsed, wiping out more than $90 billion in market capitalization. A notably bearish pattern has formed on the 1-hour chart for ADA, indicating that another pullback might be underway.
Cardano price has to climb above this level to avoid another pullback
On the 1-hour chart, ADA is bounded inside what seems to be a bear flag, which is a bearish continuation of a downtrend. Bulls need to first push Cardano price above the 50-SMA which was lost as a support level on November 25. This moving average coincides with the 200-SMA at $0.138 adding more strength to this level.
ADA/USD 1-hour chart
Furthermore, to invalidate the potential bear flag, Cardano price would need to crack the upper boundary of the ascending channel, but more importantly, climb above $0.15. By definition, if the retracement of a bear flag is higher than 50%, it usually invalidates it.
Cardano new addresses chart
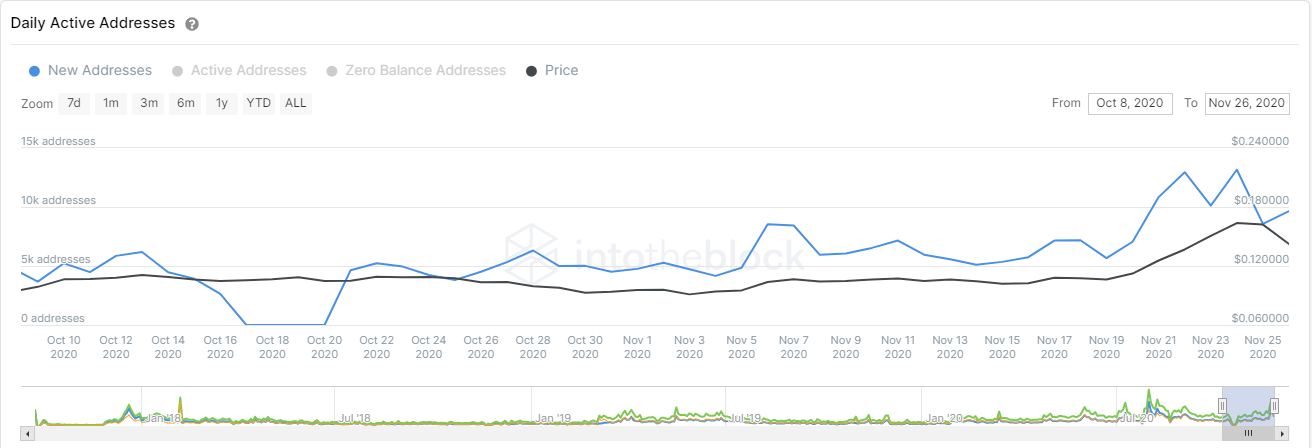
It seems that the number of new addresses joining the network of Cardano continues to rise at +70% in the past week. In the past 24 hours, this number jumped from 8,570 to 9,650 despite the pullback, indicating that new investors remain interested in the digital asset.
On the other hand, if the bear flag is confirmed and bears push Cardano price below the lower boundary of the channel, ADA can quickly dip towards $0.097, which would be the height of the previous pole.
Author

Lorenzo Stroe
Independent Analyst
Lorenzo is an experienced Technical Analyst and Content Writer who has been working in the cryptocurrency industry since 2012. He also has a passion for trading.



