|

Cardano Price Prediction: ADA to offer selling opportunity following 85% breakout

  • Cardano price is up 60% in the past five days, hitting a new 2020-high at $0.183.
  • Following the massive rally, the digital asset is presenting some bearish signs in the short-term.

Cardano had a significant breakout on November 20 above a critical resistance level established at $0.112. After the massive rally, the digital asset shows some bearish signs on the daily and 12-hour charts.

Cardano price could be poised for a pullback to $0.14

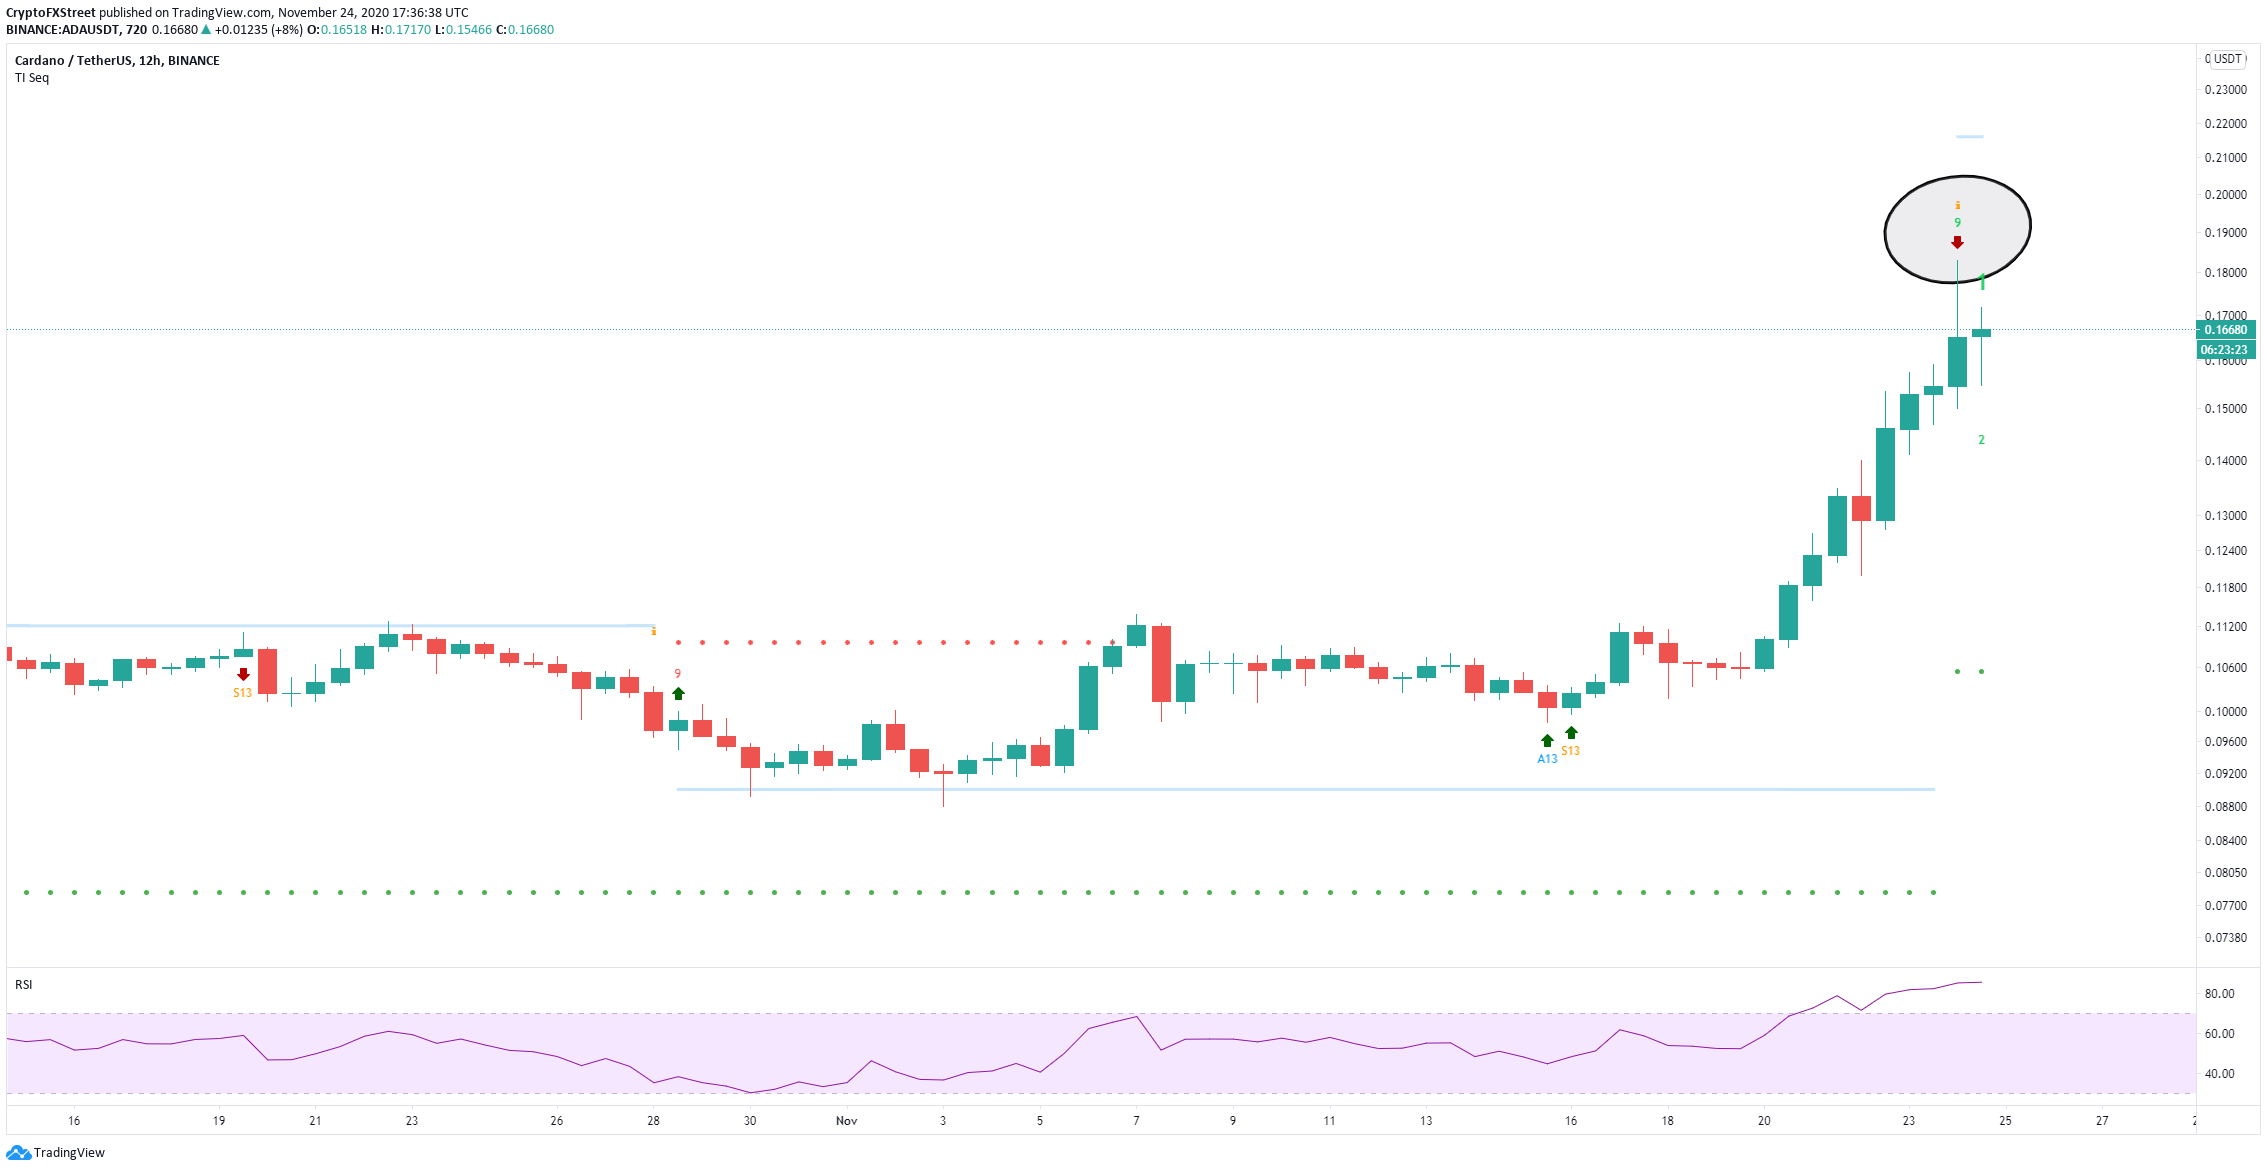
On the 12-hour chart, the TD Sequential indicator has just presented a sell signal right after the peak of $0.183. The RSI is also extremely overextended, adding even more selling pressure on Cardano.
ada price

ADA/USD 12-hour chart

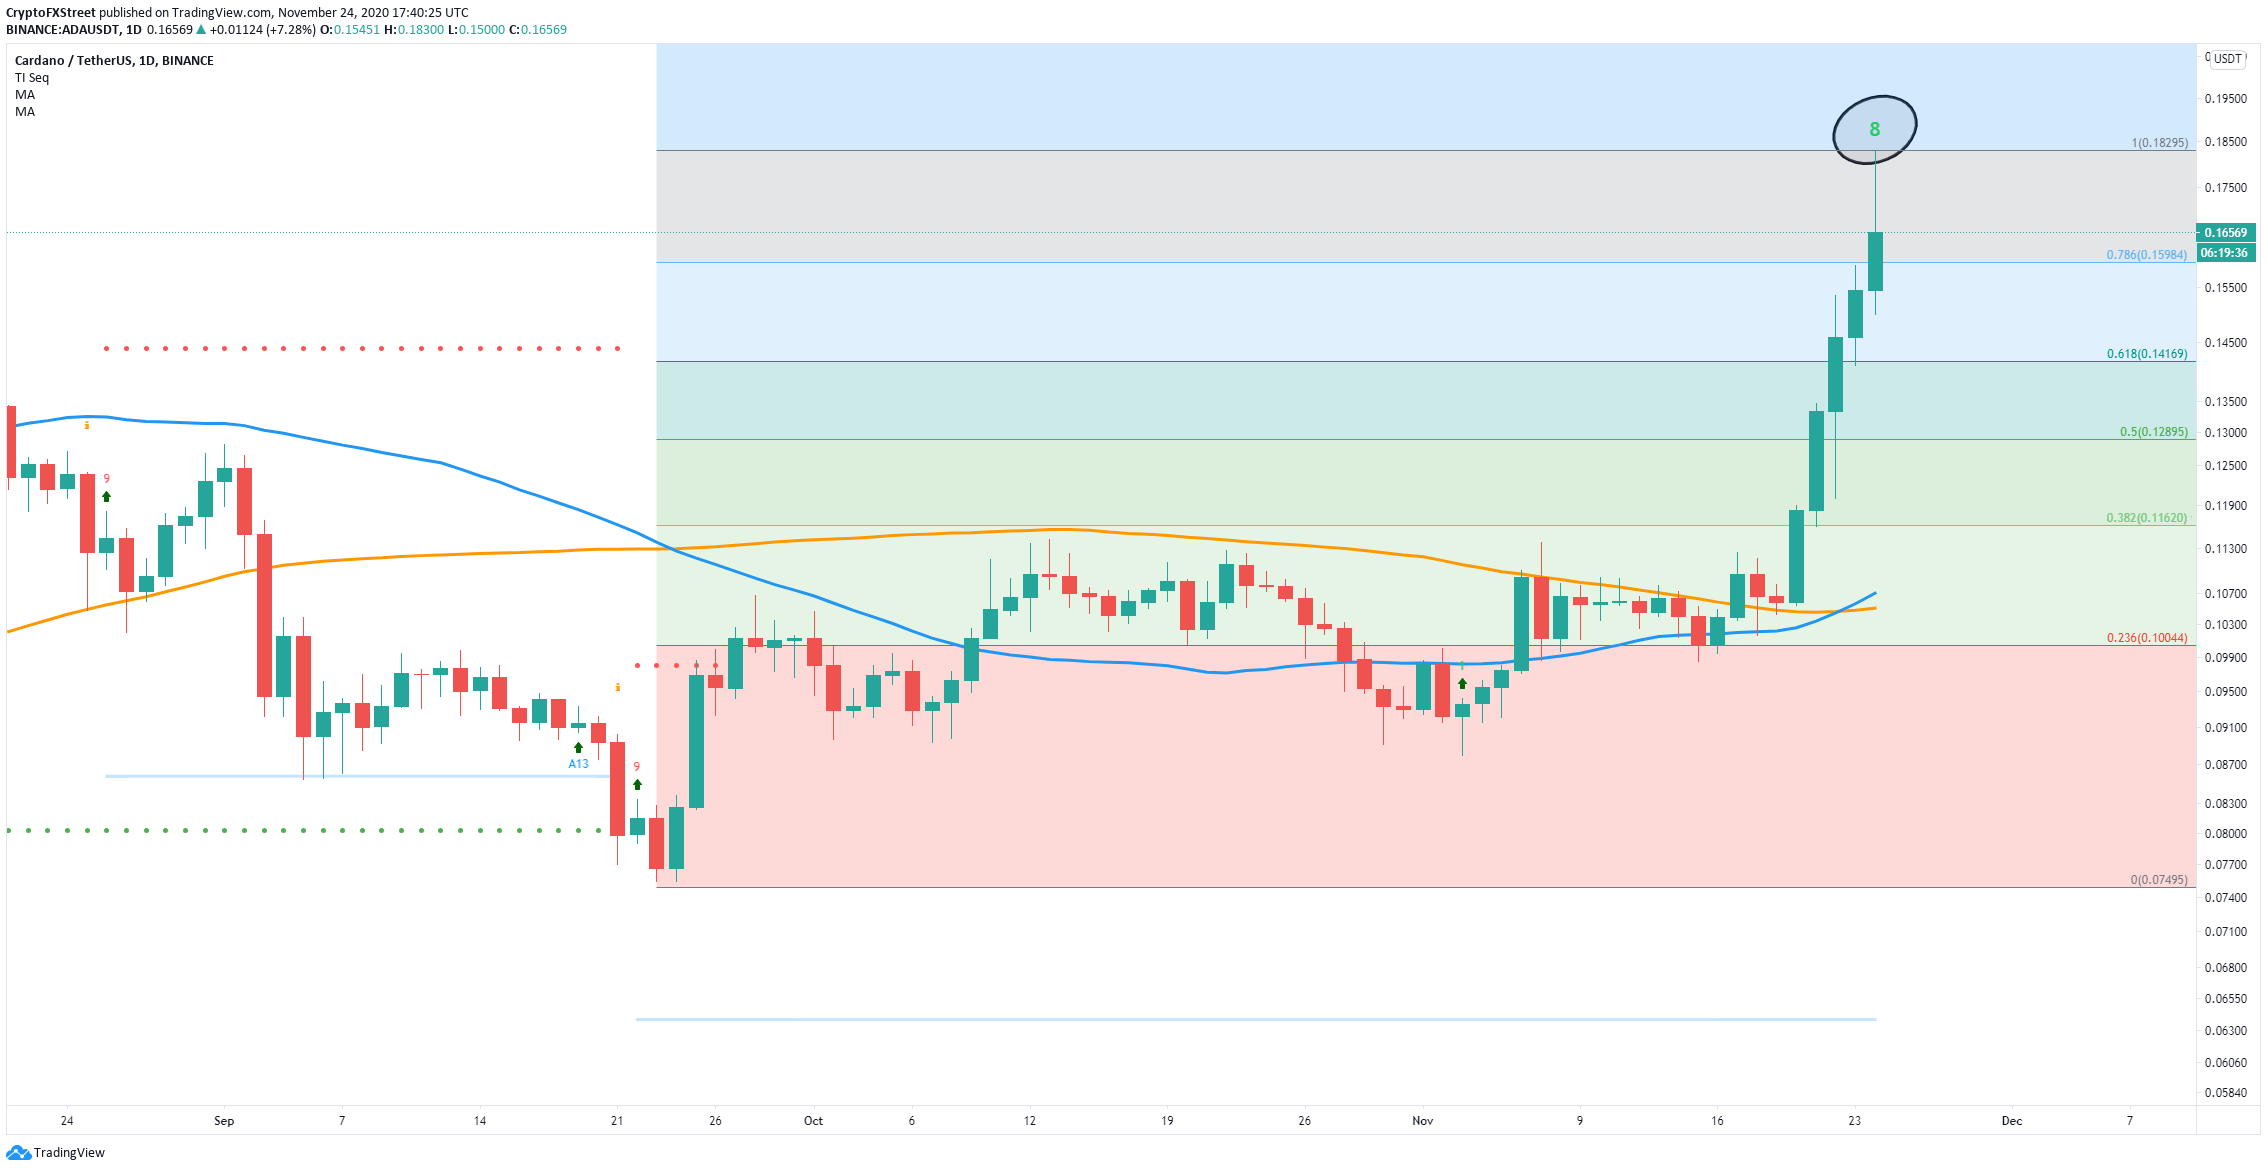
Similarly, on the daily chart, the TD Sequential is on the verge of presenting the same sell signal. Using the Fibonacci Retracement tool, we can determine some potential bearish price targets in the short-term if the sell signal is validated.
ada price

ADA/USD daily chart

The nearest support level seems to be $0.141, which is the 0.618 Fib level. The next significant point is $0.128, followed by $0.116, and finally the area between $0.105 and $0.1, which coincides with the 50-SMA and the 100-SMA as well as the 0.236 Fib level.
ada price

ADA/USD weekly chart

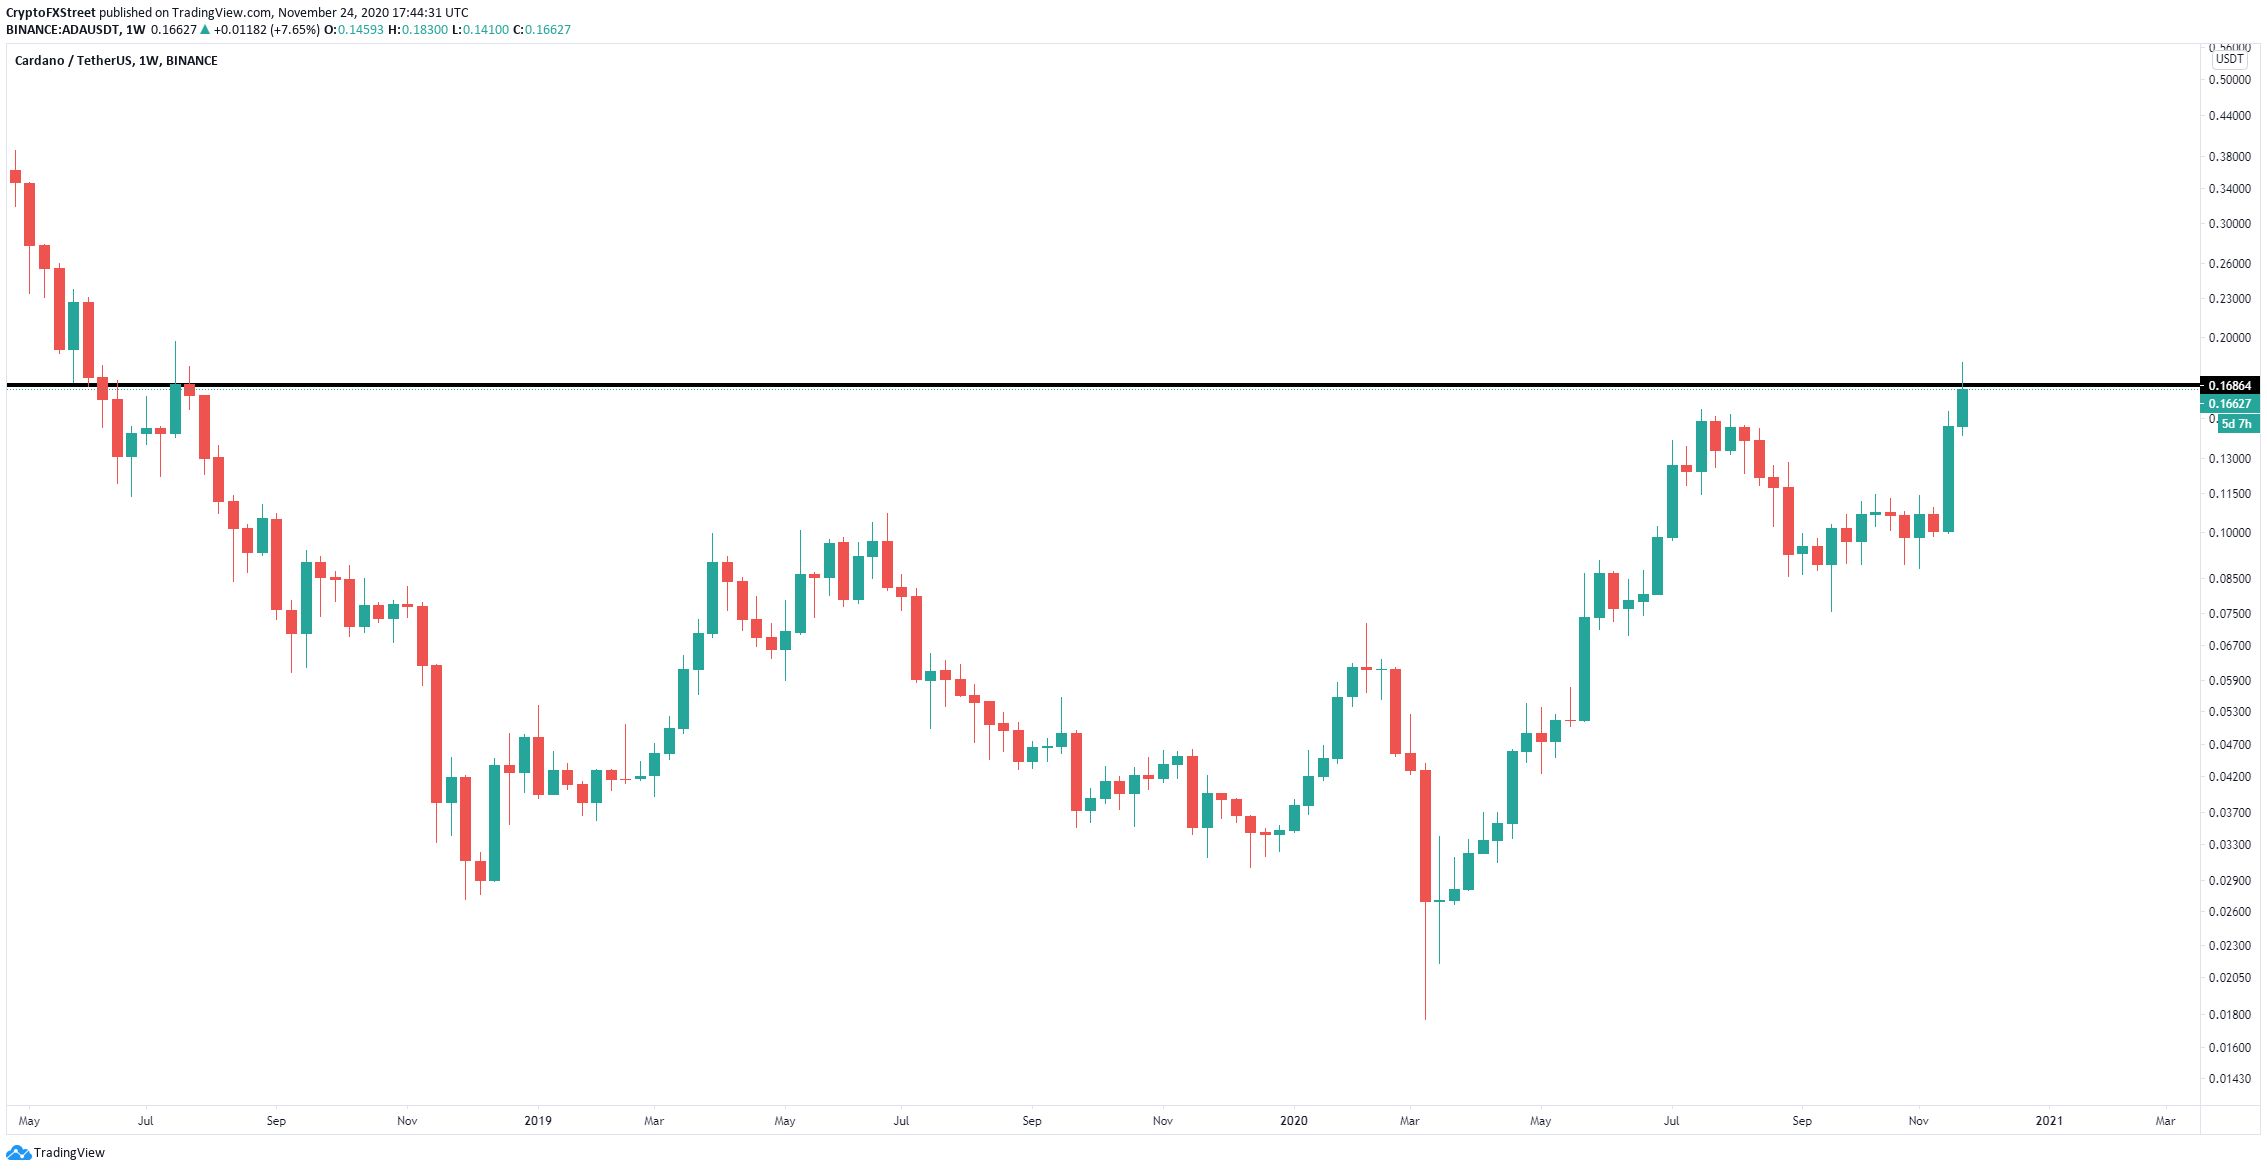
On the other hand, Cardano price is only facing a major resistance level at $0.168 on the weekly chart. A breakout above this critical level can quickly drive Cardano price towards the next level at $0.2248.

Author

Lorenzo Stroe

Lorenzo Stroe

Independent Analyst

Lorenzo is an experienced Technical Analyst and Content Writer who has been working in the cryptocurrency industry since 2012. He also has a passion for trading.


More from Lorenzo Stroe
Share:

Editor's Picks

Ripple and Stellar outlook: XRP defends key support, XLM awaits breakout as derivatives strengthen

Ripple and Stellar show divergent technical outlooks as traders assess whether the recent weakness could give way to a recovery. XRP is finding support and defining a key support zone, while XLM slips below a cluster of Exponential Moving Averages.

Crypto Overview: Bitcoin holds steady, resonates with Gold – ARB, PYTH extend gains

Bitcoin price hovers above $77,000 on Thursday, losing bullish momentum as its correlation with Gold has risen to nearly 50% over the last 90 days. Arbitrum and Pyth Network recorded double-digit gains over the last 24 hours, emerging as top performers.

Bitcoin holds $63K and $86K range as profit-taking risk builds

Bitcoin's recovery faces growing resistance as the market trades between a major accumulation zone below current prices and a dense concentration of potential supply overhead, according to a Glassnode report published Wednesday.

Robinhood Chain hits record daily fee revenue, boosts Arbitrum
Robinhood Chain generated a record $3.75 million in daily fees on Tuesday, making it the third-highest of the day behind Uniswap (UNI) and Pons, according to data from DeFiLlama. The figure marked the network's fourth consecutive day of record daily fee revenue and its highest single-day total since launching its mainnet on July 1.
Bitcoin: Billions in ETF inflows push BTC toward decisive breakout
Bitcoin (BTC) extends gains so far this week, trading near $80,000 after testing the 50-week Simple Moving Average (SMA) at $81,114 earlier. Strong institutional demand is supporting the rally, with spot BTC Exchange Traded Funds (ETFs) on track to record a second consecutive week of billion-dollar inflows.

