Cardano price attempts to slice through a massive supply barrier aiming for $0.11
- Cardano price is bounded by the 50-SMA and the 200-SMA on the daily chart.
- The TD Sequential indicator has presented a buy signal that suggests the price of ADA can climb higher.

For the past two months, the price of ADA has been contained between two major horizontal lines, one at $0.112 and the second at $0.089, only sliding through the support on September 21, to quickly recover four days later.
ADA bulls are currently fighting to stay above the daily 200-SMA, currently around $0.095, and to break the significant resistance area between $0.096 and $0.097, which would clearly shift the odds in favor of the buyers.
ADA attempts to penetrate a massive resistance area
On the daily chart, the most important short-term indicator for the bulls is the buy signal presented by the TD Sequential indicator on November 3. The last buy signal on September 22 was followed by a 31% price increase. The current price of ADA is $0.097, just above the 200-SMA at $0.095, which is acting as a healthy support level.

ADA/USD daily chart
The 50-SMA has been acting as a strong resistance level, and it's located at $0.098. It almost coincides with the robust resistance area between $0.096 and $0.097, which can be flagged using the In/Out of the Money Around Price (IOMAP) chart.
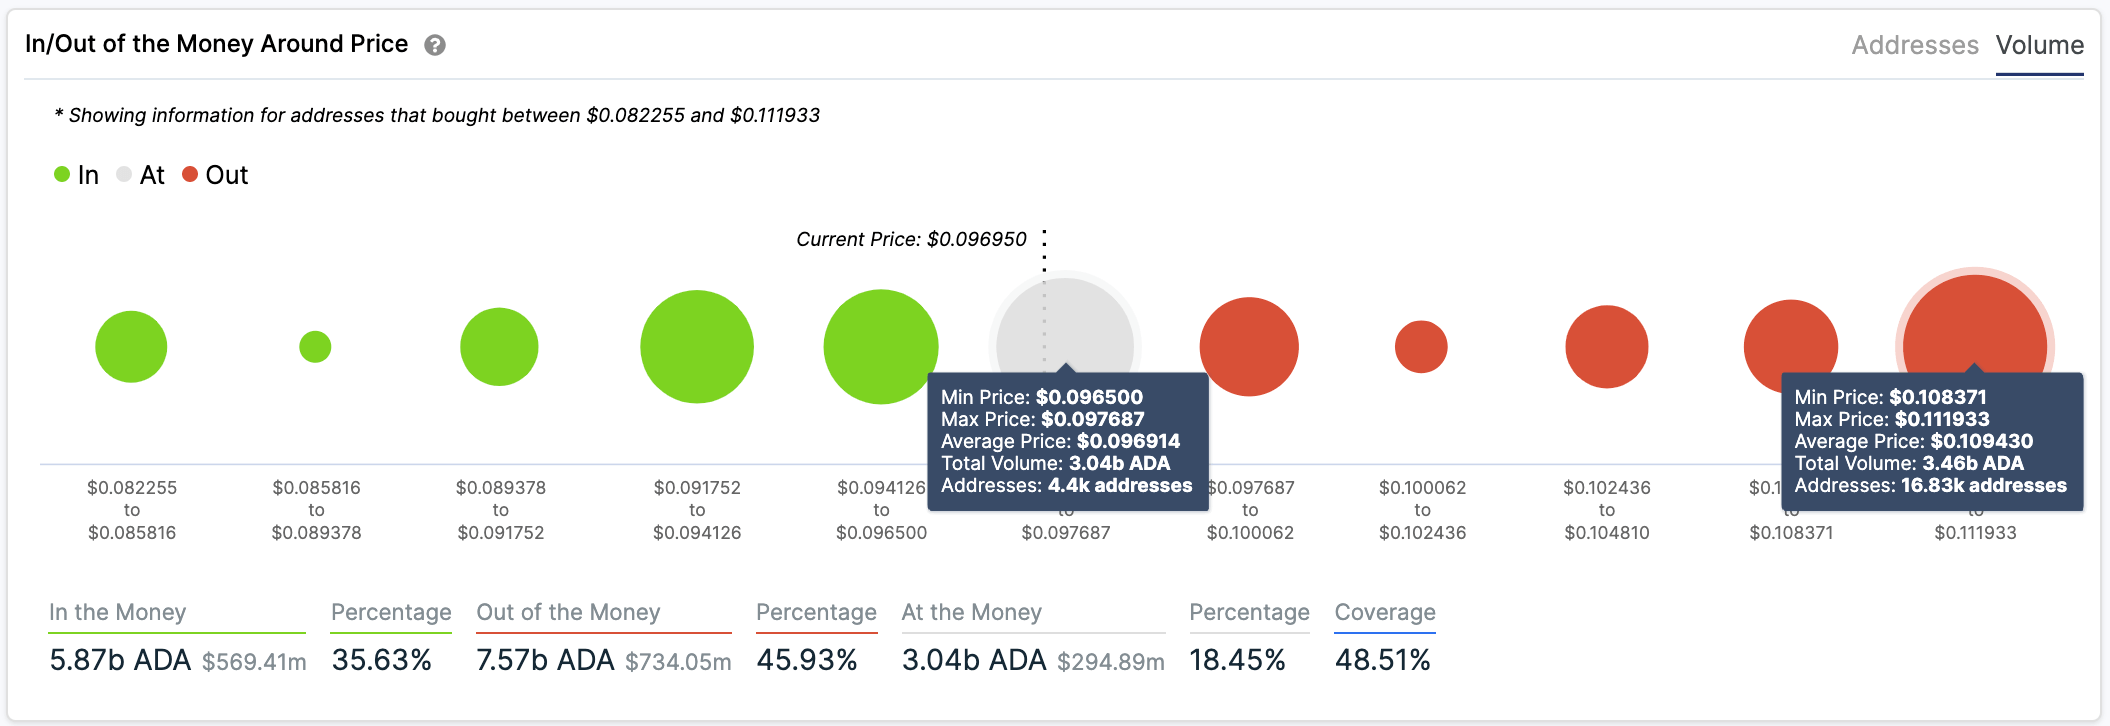
ADA IOMAP chart
In this area, 3.04 billion ADA coins were purchased by 4,400 different addresses, representing a considerable supply barrier. Above this range, those investors would be at a positive ROI (return on investing) and will likely take some profit, increasing the selling pressure. The next significant area seems to be between $0.108 and $0.112, which coincides with the upper horizontal line on the daily chart.
On the other hand, a loss of the 200-SMA at $0.095 can easily drive ADA's price towards the lower horizontal line at $0.089. The IOMAP chart shows very little support below this point, which means ADA price could continue falling towards $0.08.
Author

Lorenzo Stroe
Independent Analyst
Lorenzo is an experienced Technical Analyst and Content Writer who has been working in the cryptocurrency industry since 2012. He also has a passion for trading.