Cardano Price Forecast: ADA drops by 6.50% following rejection at $0.11 resistance line
- Cardano has dropped from $0.11 to $0.103 between October 23 and October 28.
- ADA is on the verge of flashing the buy signal in the 12-hour chart with the red nine candlestick.

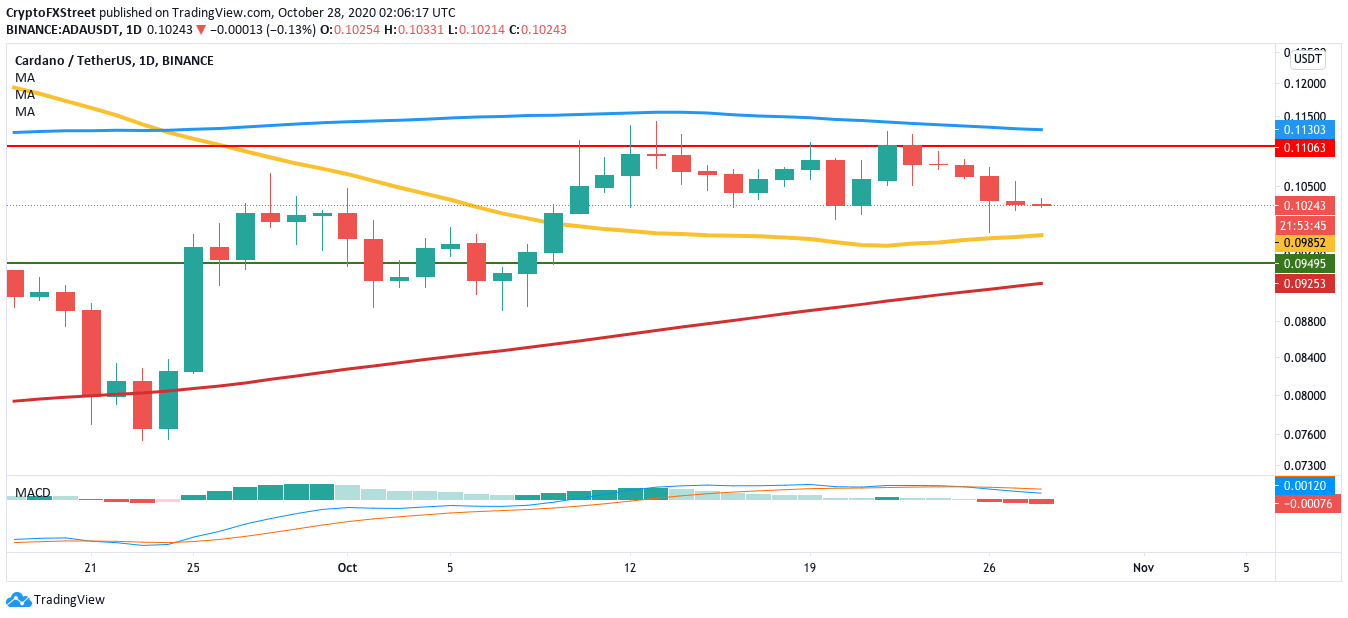
After facing rejections at the $0.11 resistance wall, Cardano has dropped to $0.103 between October 23-28. The MACD shows increasing bearish momentum, so further downtrend is expected. On the downside, the "Ethereum killer" has good support at 50-day SMA ($0.0985), $0.095 and 200-day SMA ($0.0925)
ADA/USD daily chart
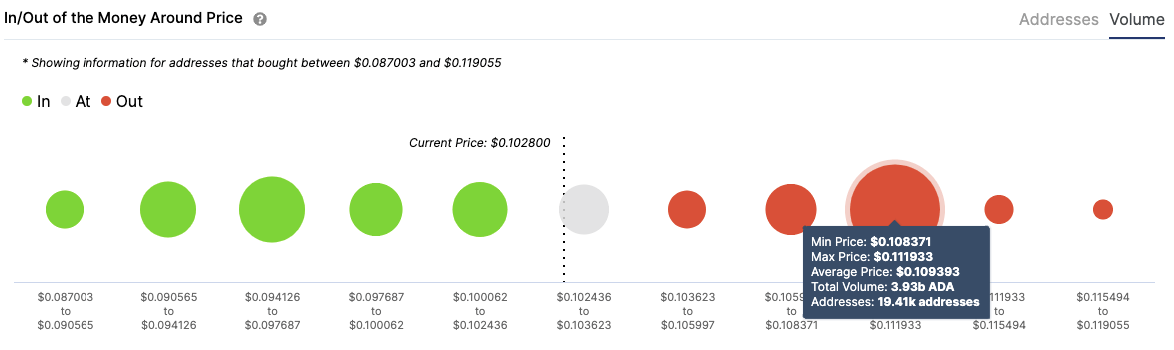
To predict ADA’s movement, let’s check IntoTheBlock’s “In/Out of the Money Around Price” (IOMAP). This tool helps us identify strong resistance and support walls. As per the tool, there is a lack of strong support zones on the downside. The only support stretch of note lies at $0.095, wherein 25,200 addresses had purchased 1.89 billion ADA tokens. A break below this will take the price down to the 200-day SMA. ($0.0925).
ADA IOMAP
The Flipside: Is there some hope for the bulls?
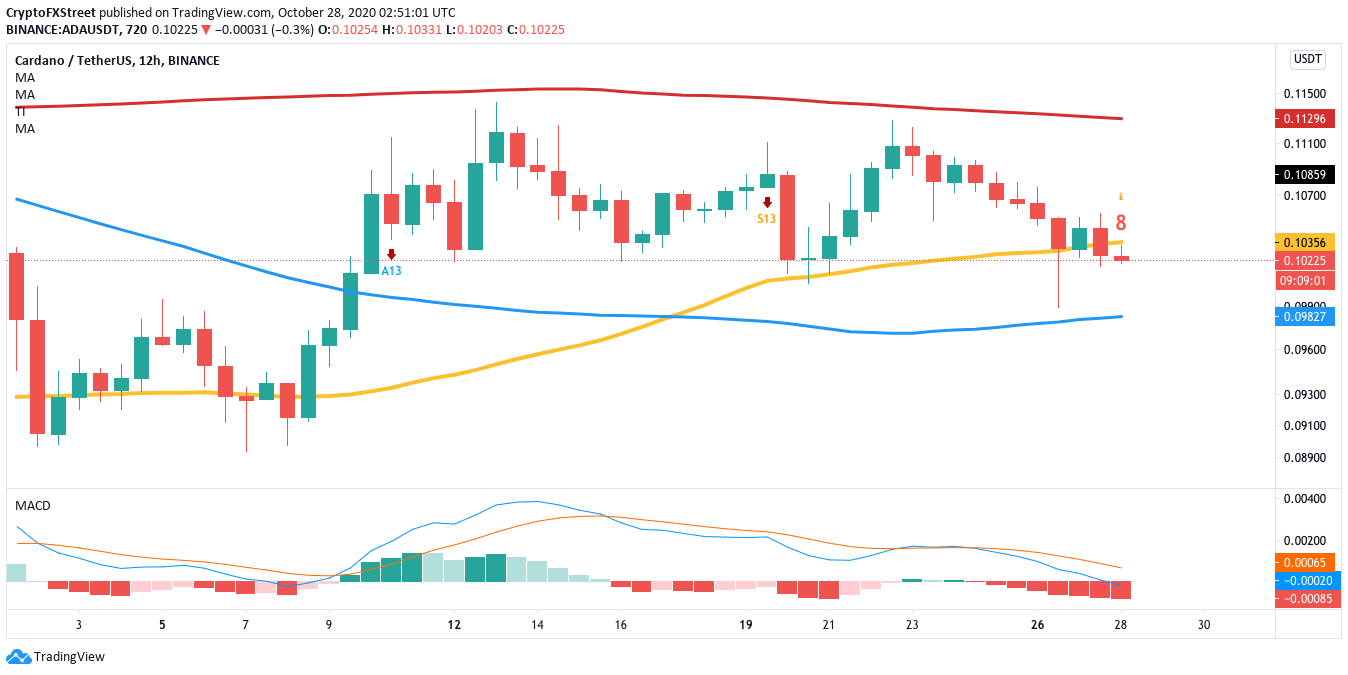
The 12-hour chart for ADA/USD shows that it is about to flash the buy signal in the TD sequential indicator with a red nine candlestick. If the buyers take advantage of this, they should break above the 50-bar SMA ($0.104). However, the upside is limited at the $0.11 resistance barrier, wherein 19,400 addresses had previously purchased 3.93 billion ADA.
ADA/USD 12-hour chart
Key price levels to watch?
Cardano bears will need to drop the price below the $0.095 support wall to continue their dominance.
ADA buyers can flip the script by taking advantage of the impending red nine candlestick and breaking past the extremely strong resistance at $0.11. However, this barrier is robust enough to absorb a lot of buying pressure.
Author

Rajarshi Mitra
Independent Analyst
Rajarshi entered the blockchain space in 2016. He is a blockchain researcher who has worked for Blockgeeks and has done research work for several ICOs. He gets regularly invited to give talks on the blockchain technology and cryptocurrencies.


