Cardano price at critical threshold, as ADA seeks to end correction
- Cardano price closed April 23 with a hammer candlestick pattern, but yesterday’s breakout failed.
- Weekly Relative Strength Index (RSI) has triggered a head-and-shoulders top pattern.
- According to Hoskinson, high probability of crypto regulations in the consumer protection section of the new tax bill.

Cardano price in two weeks has declined over 40% from top to bottom and looks for some clarity as it battles with long and short-term support. Amid the indecision is a neutral outlook for the digital token, waiting for today’s close.
Cardano price bulls hoping for burst of price strength
In an interesting twist, Canada has quietly introduced a regulatory framework on Bitcoin ETFs. In contrast, the United States has been slow at addressing the issue, putting pressure on the new administration to introduce a new regulatory framework.
It is believed that the Joe Biden administration is in the initial stages of developing a regulatory framework that would address asset classification, security law, and the responsibilities of entities.
Charles Hoskinson, the co-founder of IOHK, the developer of the Cardano blockchain platform, has articulated his belief that the upcoming tax bill will introduce crypto regulations in the area of consumer protection. He said that the explosive price action in the cryptocurrency complex over the last year underpinned by the revolution in NFTs and decentralized finance (DeFi) had created a perception of Ponzi-like trading that is finally being highly scrutinized by regulatory agencies.
Whenever market patterns like that emerge, it becomes essential for the regulators to get involved. The free markets can’t be trusted, so regulators need to be hands-on and regulate the space.
He went on to say that the global financial system was cancerous, and if it were human, it would be terminal because investors’ expectations are unrealistic. The result is an elevated level of irrational thinking and decisions.
Cardano price has discovered support at the 10-week simple moving average (SMA) on a weekly closing basis since the beginning of November 2020. Still, this week it is on pace to close below the moving average, raising the odds of a deeper correction for ADA.
Currently, the 10-week SMA is at $1.184, and the price is 4% below the moving average at $1.139. A failure to close above the critical threshold would put ADA on course to test the 100-day SMA at $.972, the April 23 low of $0.892, and potentially the 38.2% Fibonacci retracement of the 2021 rally at $0.703.
Adding to the downside pressure is the breakdown of the weekly RSI from a head-and-shoulders pattern this week.
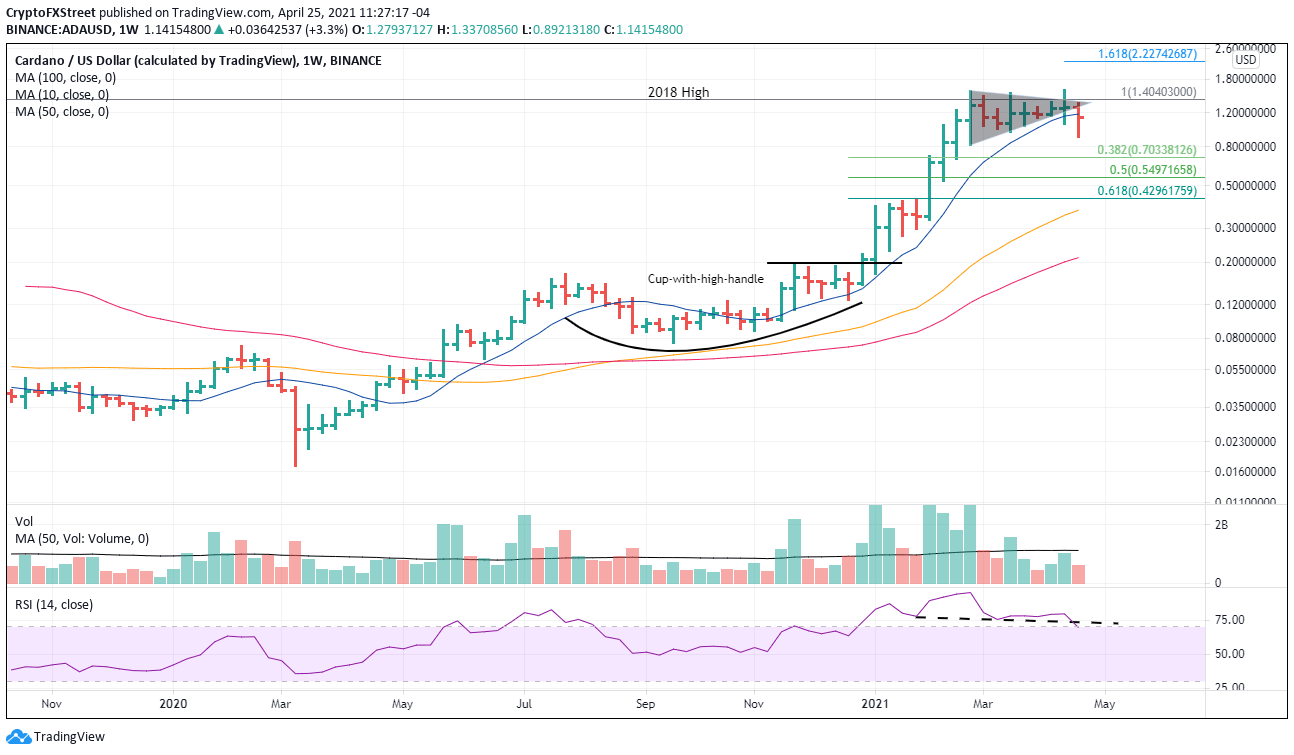
ADA/USD weekly chart
If ADA musters the impulsiveness to close above the 10-week SMA today, it will keep the long-term trend intact. A close above the April 23 hammer high at $1.192 and the 50-day SMA at $1.204 should release a rebound to the lower trend line of the symmetrical triangle at $1.307.
Following a close above the trend line, ADA should be poised to attack the all-time high recently printed at $1.570 with some resistance interrupting the rally at the 2018 high of $1.404.
Author

Sheldon McIntyre, CMT
Independent Analyst
Sheldon has 24 years of investment experience holding various positions in companies based in the United States and Chile. His core competencies include BRIC and G-10 equity markets, swing and position trading and technical analysis.


