Cardano breaks above descending trendline, eyes April high as bullish momentum builds
- Cardano extends gains on Friday, following a close above a descending trendline the previous day.
- Technical indicators and on-chain data show bullish momentum, suggesting a rally ahead.
- A daily candlestick close below $0.361 would invalidate the bullish thesis.

Cardano (ADA) extends its gains on Friday, trading 5% higher at the time of writing after rallying 12% and closing above its descending trendline on Thursday. The technical outlook and on-chain metrics support ADA’s rise, which shows that bullish momentum is gaining traction and suggests a continuation of the rally.
Cardano bulls eye for April high
Cardano price broke and closed above a descending trendline (drawn by connecting multiple highs since the end of April) on Thursday. At the time of writing on Friday, it continues to edge higher around $0.431.
If ADA maintains its upward momentum and closes above its daily resistance at $0.445, it could extend the rally by 45% from its current level to retest its April 9 high of $0.624, which roughly coincides with the 61.8% Fibonacci retracement level (drawn from March high of $0.810 to an August low of $0.277) at $0.606.
The Moving Average Convergence Divergence (MACD) indicator further supports Cardano’s rise, signaling a bullish crossover on Thursday’s daily chart. The MACD line (blue line) moved above the signal line (yellow line), giving a buy signal. However, the Relative Strength Index (RSI) stands at 70, entering overbought conditions. Traders should be cautious of adding new long positions because the chances of a price pullback increase.
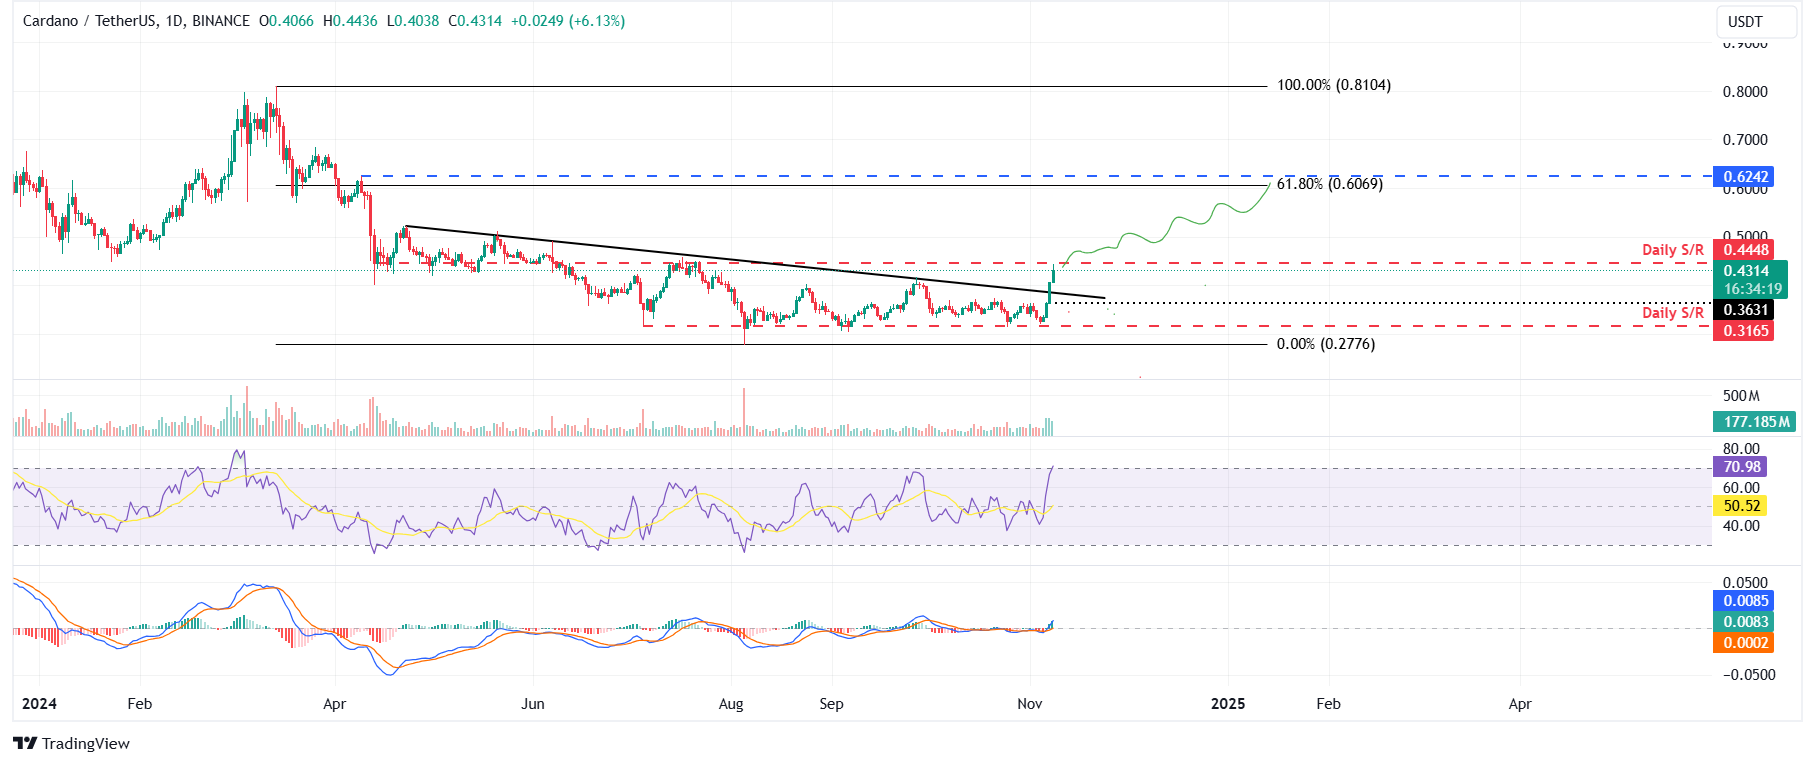
ADA/USDT daily chart
Cardano’s on-chain data further supports the bullish thesis. Coinglass’s data shows that the futures’ Open Interest (OI) in Cardano at exchanges is increasing. Increasing OI represents new or additional money entering the market and new buying, which suggests a bullish trend.
The graph below shows that ADA’s OI increased from $217.71 million on Wednesday to $329.01 million on Friday, the highest level since mid-April.
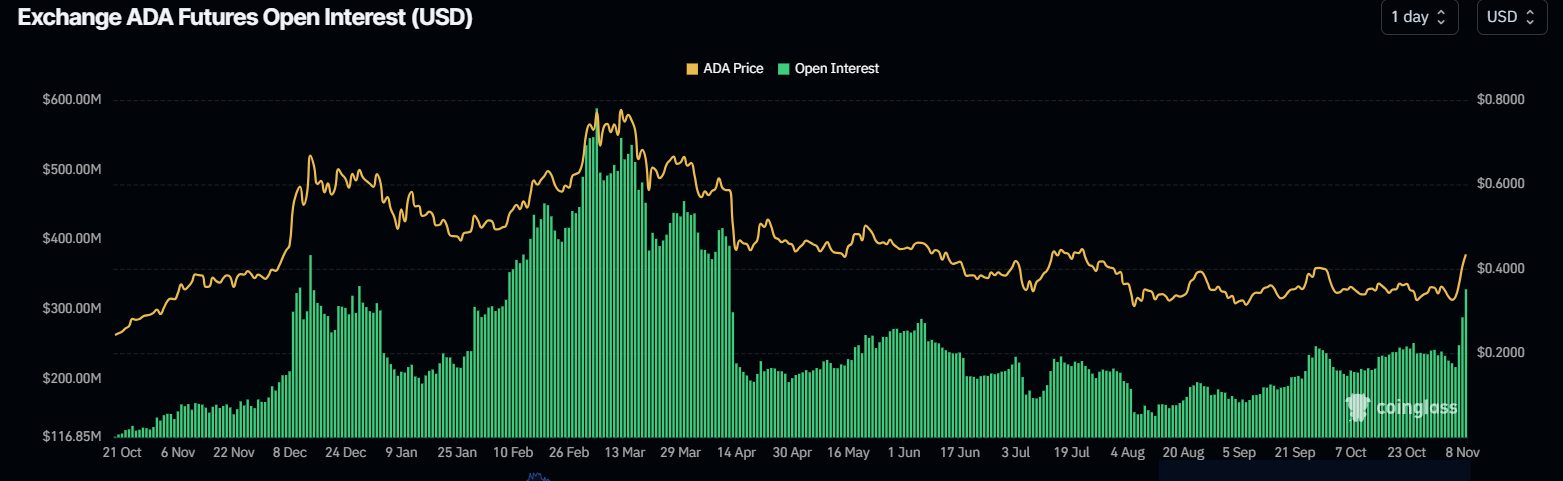
ADA Open Interest chart. Source: Coinglass
Santiment’s Age Consumed index aligns with the bullish outlook noted from the technical perspective. Spikes in this index suggest dormant tokens (tokens stored in wallets for a long time) are in motion and can be used to spot short-term local tops or bottoms.
For ADA, history shows that the spikes at the Age Consumed index were followed by a rally in Cardano’s price. The most recent uptick on Wednesday also forecasted that ADA was ready for an uptrend.
%20[11.18.54,%2008%20Nov,%202024]-638666522895959683.png)
ADA Age Consumed index chart. Source: Santiment
Despite the bullish thesis signaled by both on-chain data and technical analysis, the outlook will shift to bearish if Cardano's daily candlestick closes below Thursday's low of $0.361. This scenario could lead to a 12.40% crash to retest its daily support at $0.316.
Author

Manish Chhetri
FXStreet
Manish Chhetri is a crypto specialist with over four years of experience in the cryptocurrency industry.


