Top trending meme coins PEPE, BONK, and FLOKI achieve double-digit gains following Trump’s victory
- Pepe, Bonk and FLOKI registered more than 10% gains on Wednesday as Trump wins the US presidential election.
- The three meme coins hover around key levels, and breakout signals the possibility of further gains.
- The RSI and MACD are flipping bullish for PEPE, BONK and FLOKI, increasing the odds of sustained upward momentum.

The prices of top trending meme coins Pepe (PEPE), Bonk (BONK) and FLOKI (FLOKI) experienced double-digit gains following Trump’s victory on Wednesday. The technical outlook suggests that the three meme coins hover around key levels, and the breakout could push these coins higher.
PEPE is poised for a rally if it closes above its descending trendline
Pepe price surged over 15.65% on Wednesday and closed above the 50-day Exponential Moving Average (EMA) at $0.0000093. At the time of writing on Thursday, it is breaking above the descending trendline and trades above $0.000010.
If the PEPE daily candlestick breaks above the descending trendline and closes above $0.0000099, it would rally 24% from its current level to retest its 61.8% Fibonacci retracement level at $0.000012.
The Relative Strength Index (RSI) on the daily chart reads at 59, above its neutral level of 50, indicating that bullish momentum is gaining traction. Additionally, the Moving Average Convergence Divergence (MACD) indicator on the daily chart is about to flip a bullish crossover on Thursday, giving a buy signal and indicating upward momentum.
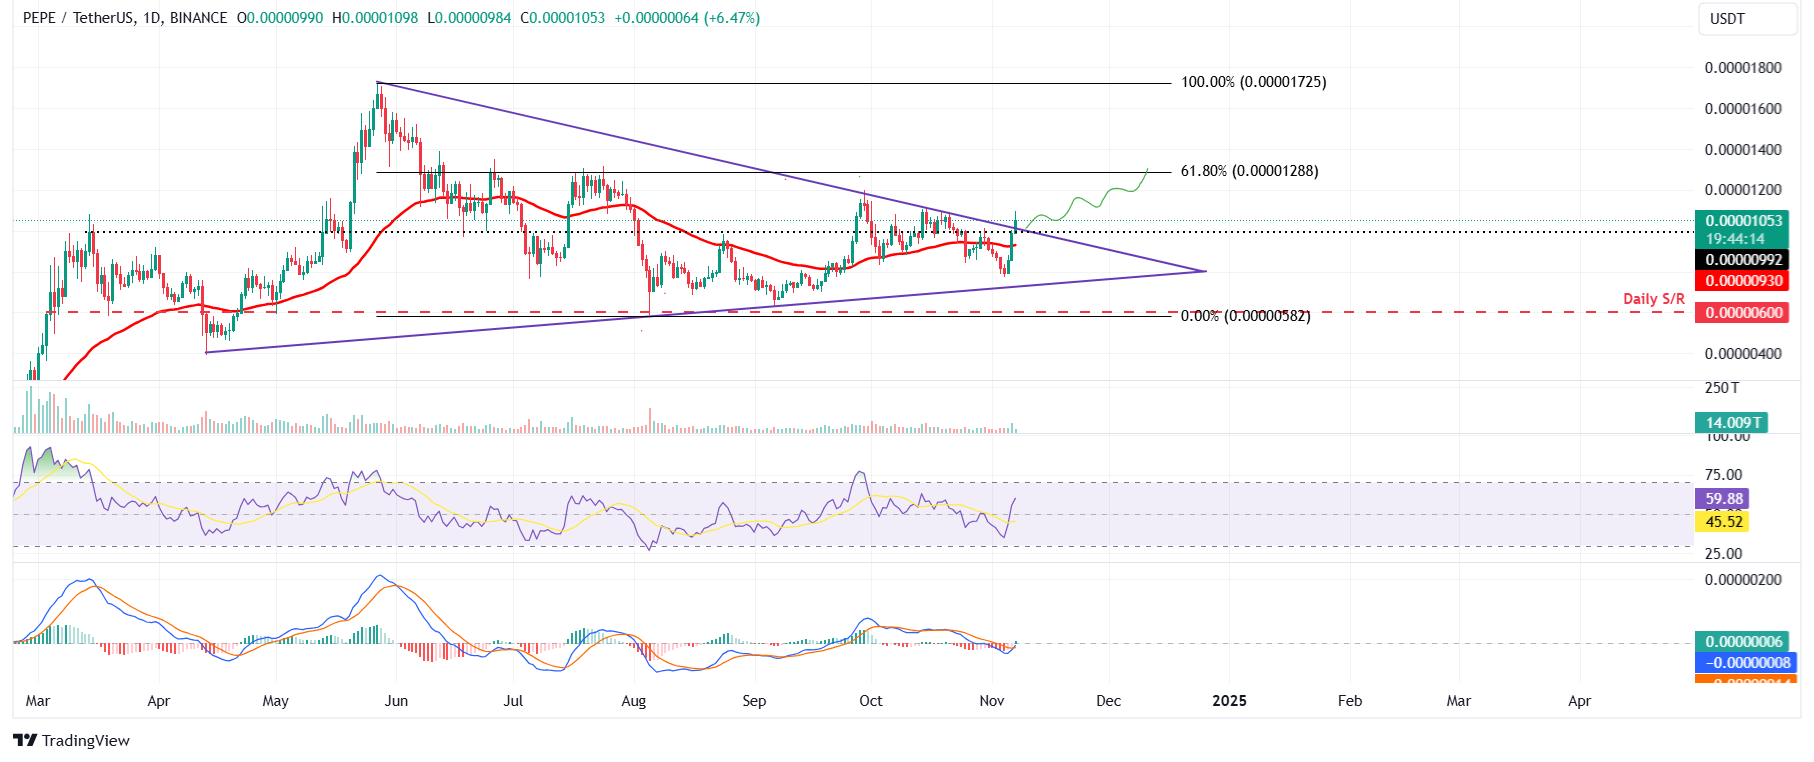
PEPE/USDT daily chart
However, if PEPE fails to close above the descending trendline and declines, closing below its 50-day EMA at $0.0000093, the bullish thesis would be invalidated. This scenario could lead to a future decline in Pepe’s price to retest its November 4 low of $0.0000077.
BONK is set for a double-digit gain if it closes above the key resistance level
Bonk price rallied over 17.5% on Wednesday and closed above its 50-day EMA at $0.000020. As of Thursday, it trades slightly down around $0.000022, facing resistance from its descending trendline.
If BONK breaks above its descending trendline and closes above its daily resistance level of $0.000025, it could rally 32% from its daily resistance level to retest its 61.8% Fibonacci retracement level at $0.000033.
The RSI on the daily chart reads at 55, above its neutral level of 50 and points upwards, indicating that bullish momentum is gaining traction. Additionally, the MACD indicator on the daily chart is about to flip a bullish crossover on Thursday, giving a buy signal and indicating upward momentum.
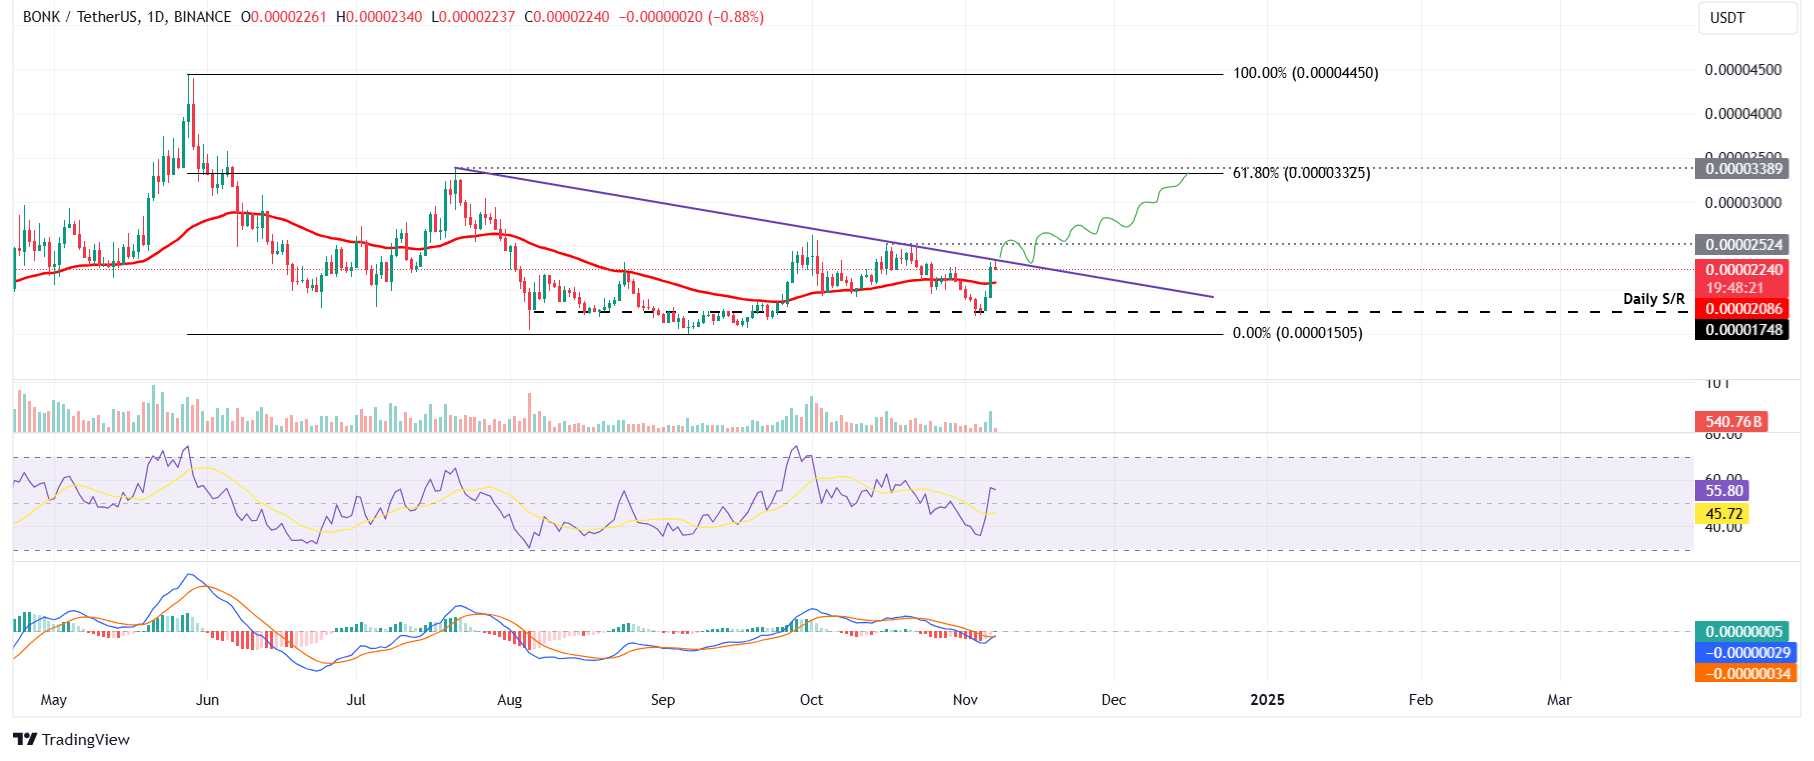
BONK/USDT daily chart
Conversely, if BONK fails to break above the descending trendline and closes below its 50-day EMA support at $0.000020, it would extend the decline by 15% to retest its next daily support at $0.000017.
FLOKI price looks promising
FLOKI price rose 14% on Wednesday, closing above its 50-day EMA at $0.00013 after finding support around its daily level of $0.00011 on Monday. At the time of writing on Thursday, it hovers around $0.00014.
If the 50-day EMA at $0.00013 holds as support and FLOKI closes above the daily resistance at $0.00015, it could extend the rally by 20% to retest its July 27 high of $0.000188.
The RSI on the daily chart reads 53, above its neutral level of 50, indicating that bullish momentum is gaining traction. Additionally, the MACD indicator on the daily chart is about to flip a bullish crossover on Thursday, like BONK’s chart, as mentioned above.
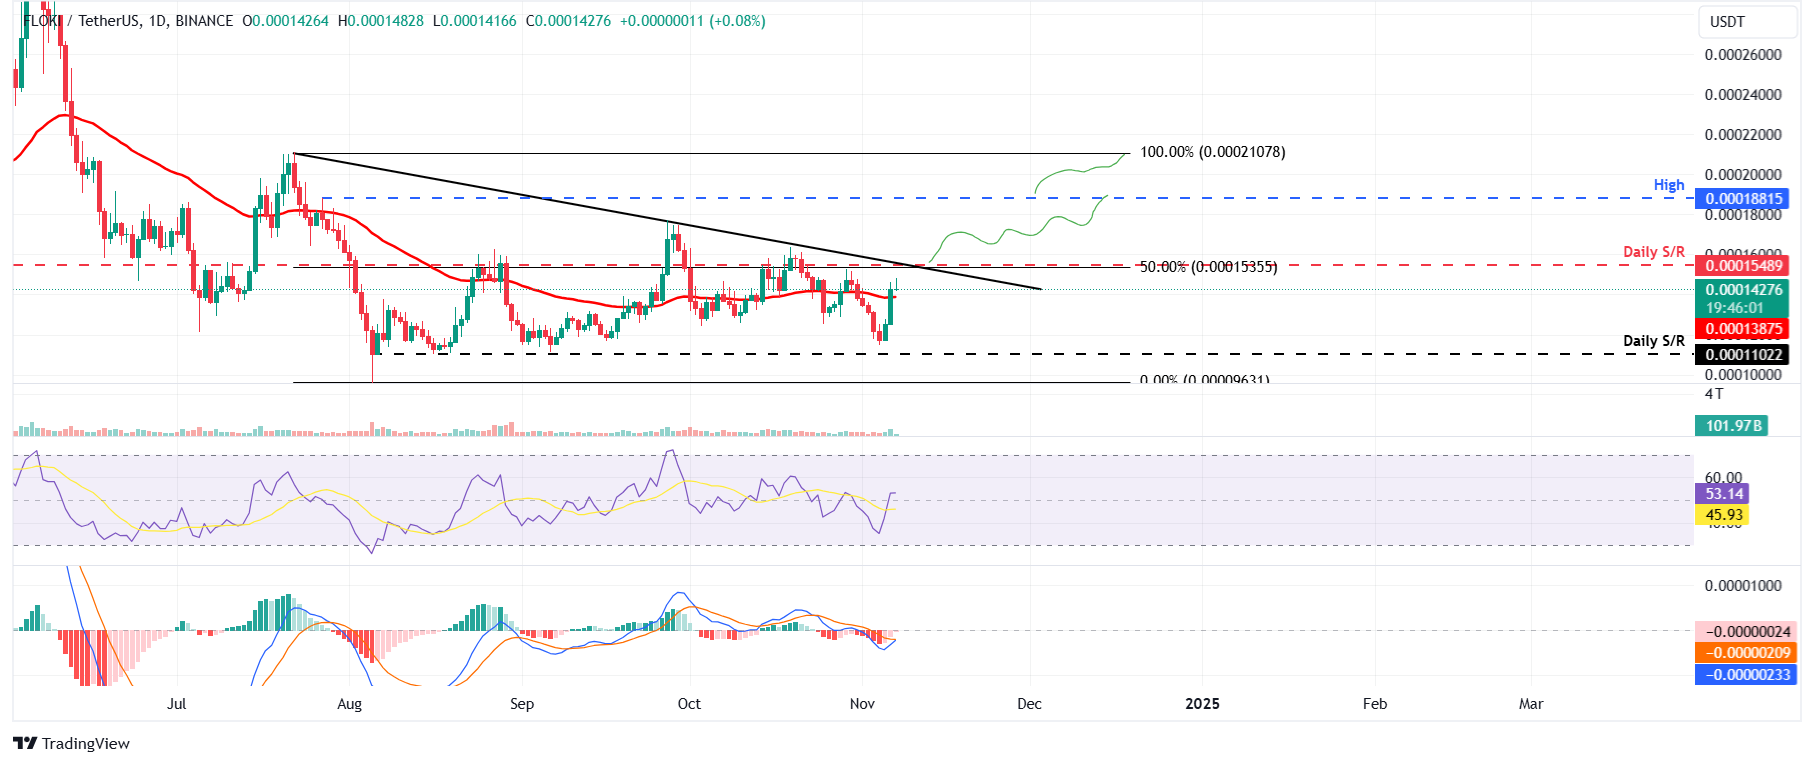
FLOKI/USDT daily chart
However, if the 50-day EMA at $0.00013 fails to hold as support, FLOKI would extend the decline to retest its daily support at $0.00011.
Author

Manish Chhetri
FXStreet
Manish Chhetri is a crypto specialist with over four years of experience in the cryptocurrency industry.


