Can one expect the continued fall of the crypto market until the end of the month?

The new week has begun with the sharp drop of the cryptocurrency market as all coins from the top 10 list are in the red zone.
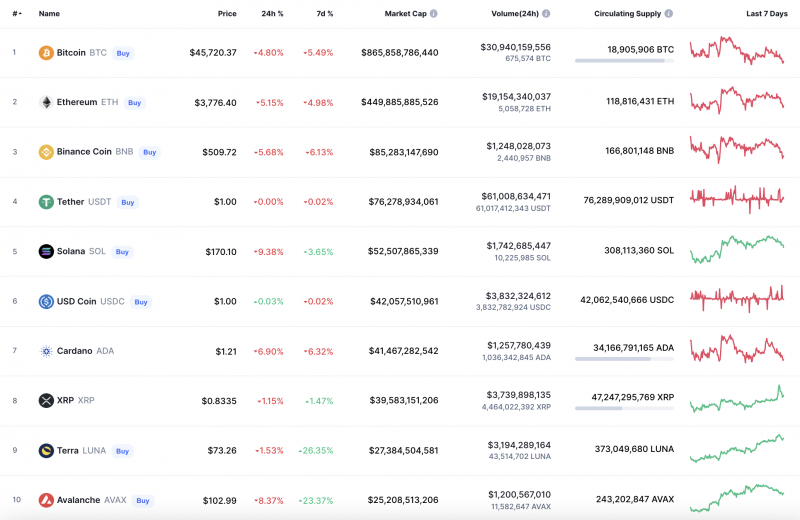
Top coins by CoinMarketCap
BTC/USD
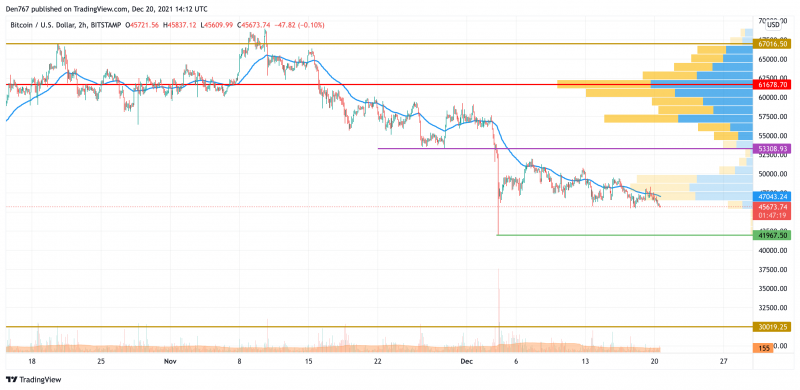
Over the weekend, the Bitcoin (BTC) price consolidated in a wide sideways range between the support at $46,000 and the resistance at $47,745.
BTC/USD chart by TradingView
On Sunday, the bulls tried to leave the sideways range and were able to pierce its upper border several times; however, sellers kept the BTC price below the two-hour EMA55.
If the level of average prices continues to keep the pair in a local downtrend, then this week the bears can roll back the Bitcoin price to the $42,447 support level.
Bitcoin is trading at $45,672 at press time.
XRP/USD
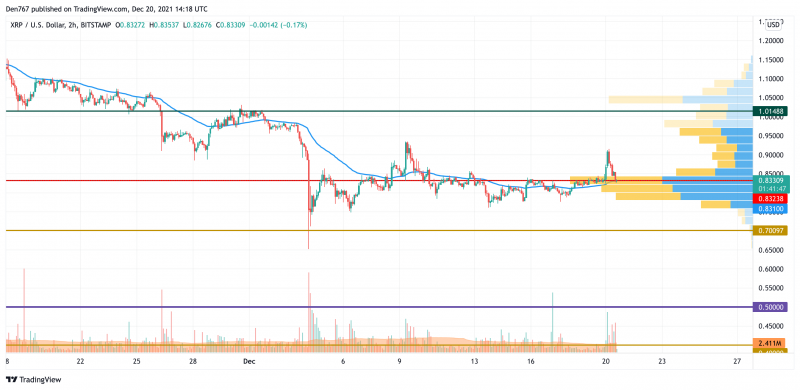
On Saturday, XRP broke above the two-hour EMA55 and stayed above this moving average in a tight consolidation all weekend.
XRP/USD chart by TradingView
Buyers formed a rather strong bullish momentum tonight, which allowed the pair to test the level of $0.90. On the daily time frame, the Stoch RSI indicator lines entered the overbought zone. But if the bulls manage to continue to rise, the pair might test the resistance of $0.96.
On the other hand, in the near future, the indicator lines should leave the overbought zone. Therefore, one can expect a return below the support of $0.80.
XRP is trading at $0.8231 at press time.
ADA/USD
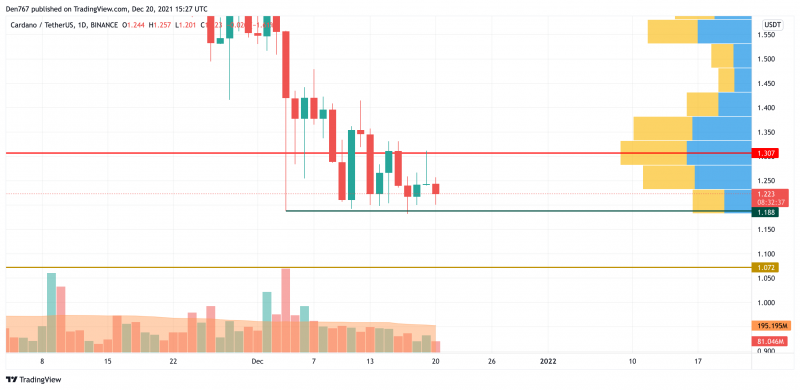
Cardano (ADA) is the biggest loser from the list, falling by 6.33%.
ADA/USD chart by TradingView
Cardano (ADA) has approached the vital support level at $1.188. One needs to pay close attention to the way the price is entering this zone. If the daily candle fixes below it, that may be a reason for a mid-term bearish trend until the end of the month.
ADA is trading at $1.221 at press time.
BNB/USD
Binance Coin (BNB) is also following the decline of Cardano (ADA), going down by 5% since yesterday.
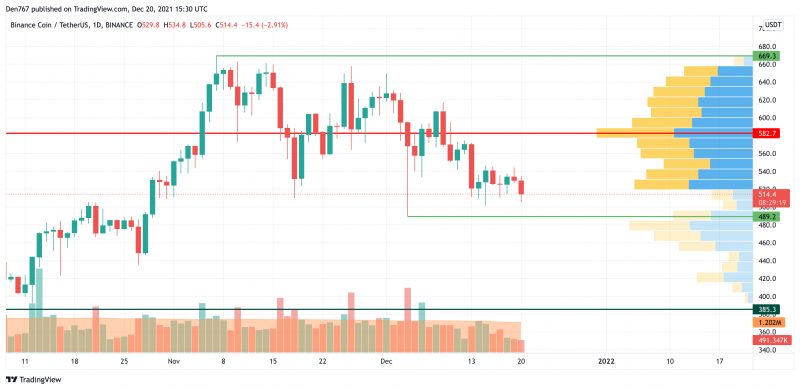
BNB/USD chart by TradingView
Contrary to Cardano (ADA), BNB is located far away from the support, which means that sideways trading is the more likely scenario for the native exchange coin. In this case, the rate is about to locate between the important mark of $500 and the zone of the most liquidity around $580.
BNB is trading at $513.80 at press time.
Read full original article on U.Today
Author

Denys Serhiichuk
U.Today
With more than 5 years of trading, Denys has a deep knowledge of both technical and fundamental market analysis.



