|

BTC/USD technical analysis: Bitcoin bulls are hoping for a break of this chart pattern

  • Bitcoin trades 0.88% lower today as sentiment takes a hit.
  • There is a wedge type chart pattern on the 4-hour chart.
  • If price breaks lower support is under 10k at 9,759.62.
Bitcoin market analysis
Bitcoin trades lower today as general crypto sentiment is negative.

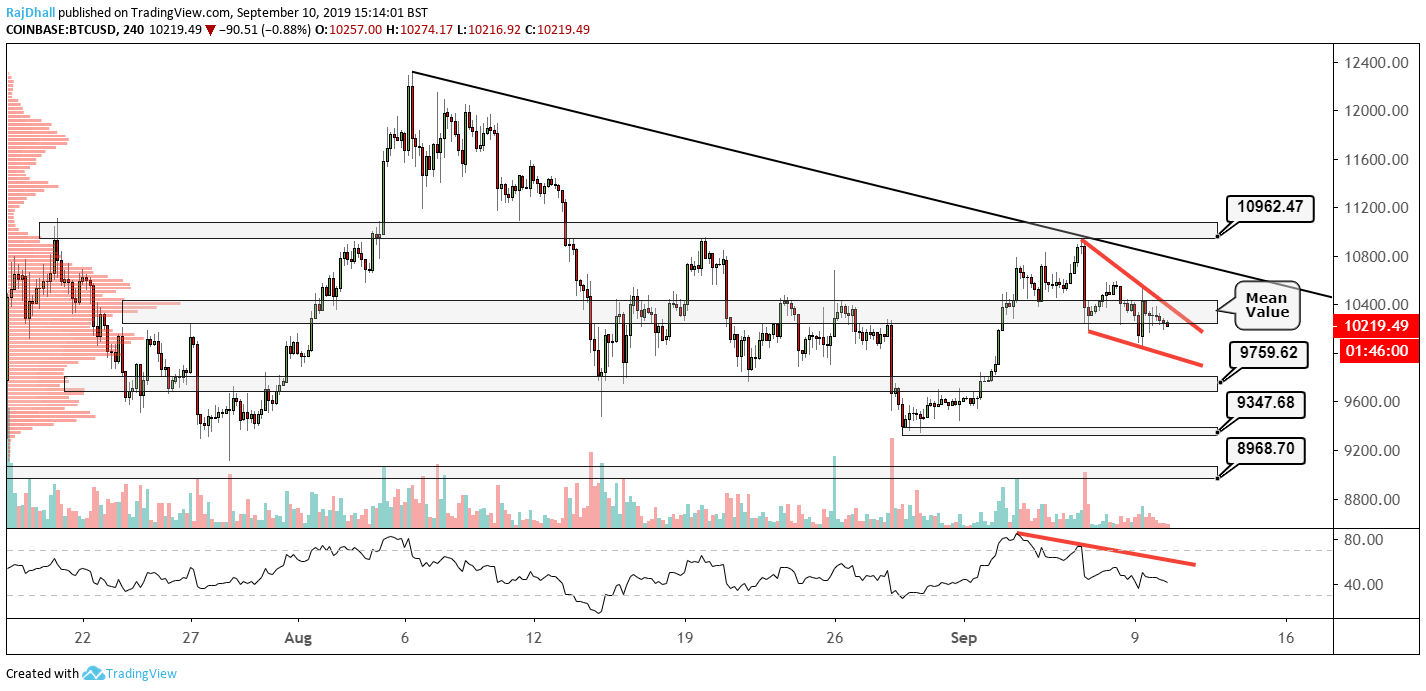
Looking at the 4-hour price chart the lack of vol is clear as the market consolidates near the 10,200 level.

A wedge formation has formed now in a short term intraday price pattern and a break in either direction could give us some clues to the future path of price. 

The 10k mark has been a great area of support in recent times and it could continue to be a sticking point.

On the RSI you can clearly see price is depressed. Although it has not reached oversold levels yet. I have marked a trendline on the RSI indicator and a break of this and the chart pattern will help the bullish cause. 

On the topside, 11k has proven to be a formidable barrier for the BTC/USD pair and we have had two firm rejections one on August 19th and another on the 6th September. 

10,425 remains the mean value area on the chart and the area where most contracts have changed hands on the Binance exchange. So keep an eye on what happens to the price if we get back to that level as it is clearly a price that traders are interested in.

Overall, bulls are looking for a bullish break of the chart pattern up to the trendline marked in black. If this fails the two support levels that come in to play are 9,347 and 8,968.

Author

Rajan Dhall, MSTA

Rajan Dhall is an experienced market analyst, who has been trading professionally since 2007 managing various funds producing exceptional returns.

More from Rajan Dhall, MSTA
Share:

Editor's Picks

Top 3 Price Prediction: Bitcoin, Ethereum, Ripple deepen sell-off as bears take control of momentum

Bitcoin, Ethereum, and Ripple continued their corrections on Friday, posting weekly losses of nearly 6%, 3%, and 5%, respectively. BTC is nearing the November lows at $80,000, while ETH slips below $2,800 amid increasing downside pressure.

Shiba Inu Price Forecast: SHIB extends losses as whale selling intensifies bearish momentum

Shiba Inu (SHIB) price slips below $0.0000077 on Thursday after correcting the previous day. Bearish sentiment is further strengthened as holders offload SHIB, increasing selling pressure and reducing Open Interest in the derivatives market.

Top Crypto Losers: Worldcoin, Chiliz, Hyperliquid lead losses as market bleeds $1.75 billion

Worldcoin , Chiliz , and Hyperliquid posted heavy losses over the last 24 hours as Bitcoin dropped below $82,000 on Friday, triggering a $1.75 billion wipeout and mirroring the bearish tremors in the US stock market.

Fidelity unveils FIDD stablecoin, set to launch in coming weeks

Fidelity Investments announced that it will launch its first stablecoin, the Fidelity Digital Dollar (FIDD), making it one of the first large traditional firms in the US to do so.

Bitcoin Price Annual Forecast: BTC holds long-term bullish structure heading into 2026

Bitcoin (BTC) is wrapping up 2025 as one of its most eventful years, defined by unprecedented institutional participation, major regulatory developments, and extreme price volatility.

Bitcoin: BTC correction deepens as Fed stance, US-Iran risks, mining disruptions weigh

Bitcoin (BTC) price extends correction, trading below $82,000 after sliding more than 5% so far this week. The bearish price action in BTC was fueled by fading institutional demand, as evidenced by spot Exchange-Traded Funds (ETFs), which recorded $978 million in inflows through Thursday.