BTC/USD: Its a make or break at 36170

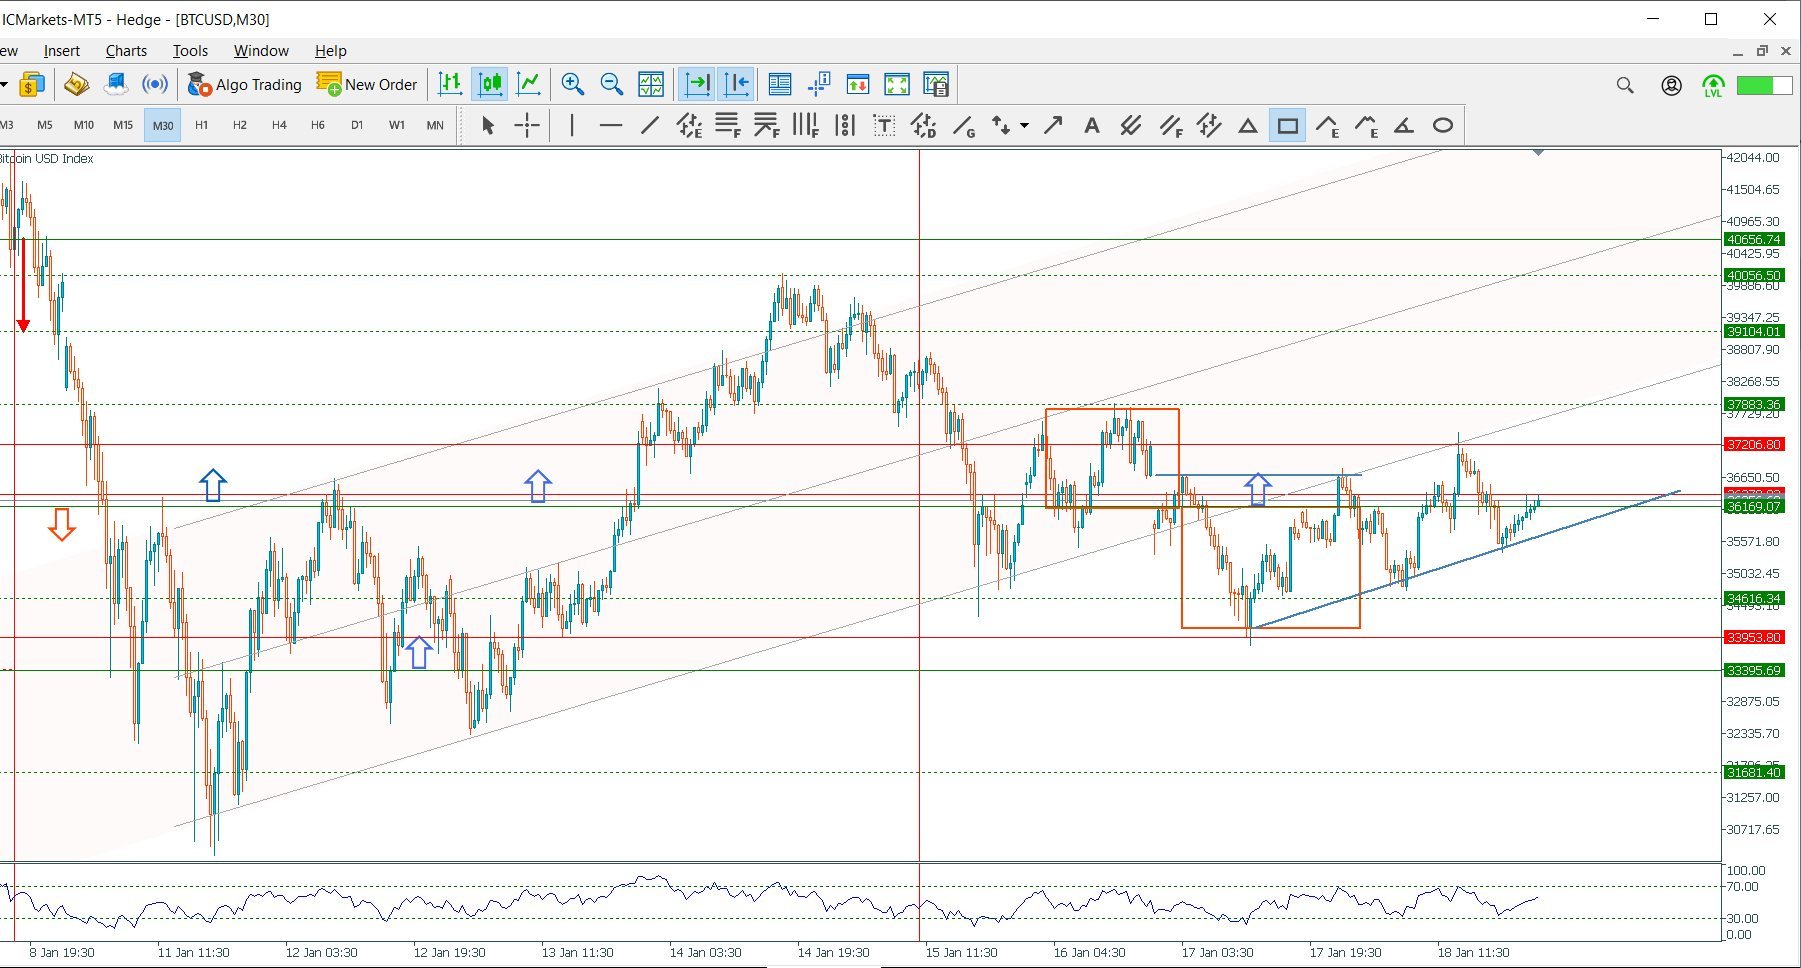
BTC/USD is trending up again in the 30 minutes time frame; the price structure has changed since the weekend selloff with higher highs and higher lows. Prices fell below the crucial point at 36170 in yesterday's session but bounced back and continued to retest this critical level as we saw rises and falls in the last 24 hrs.
AS of writing, BTC was heading towards 36170 after a pullback from a higher high at 37430 in the 30 minutes chart; 37884 is still a contender if it breaks previous highs.
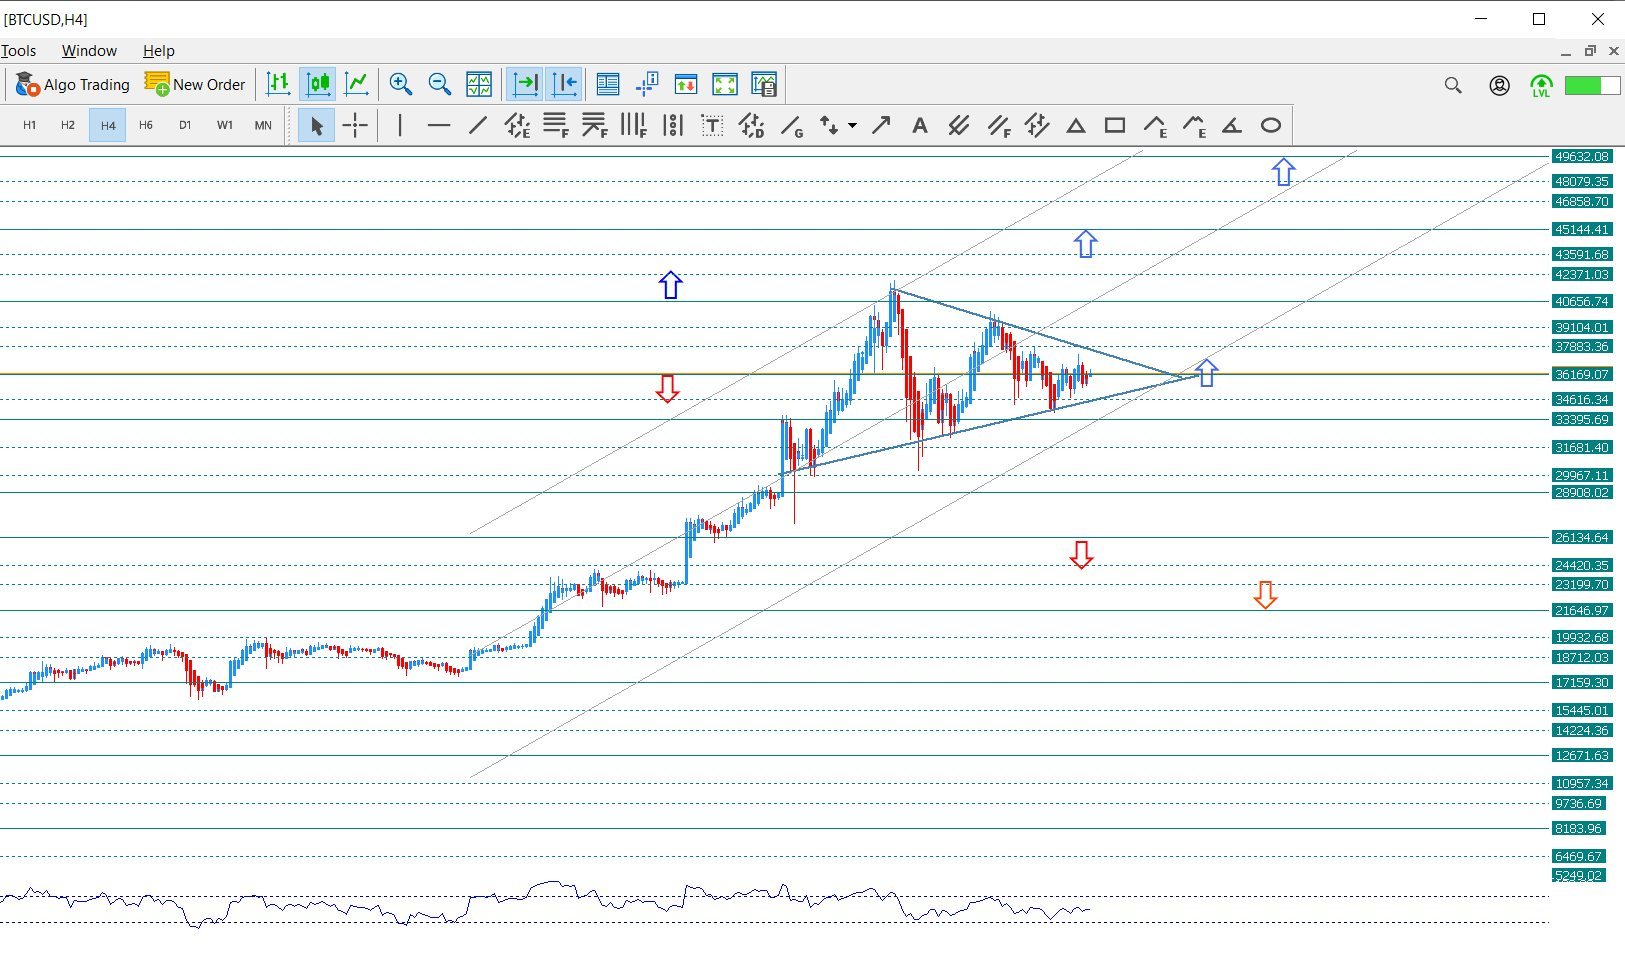
The H4 price chart reveals a symmetrical triangle, which could favour the bulls since the overall direction is still in an uptrend. Prices are being squeezed as it approaches the end of the triangle at 36170. However, it could swing to the downside if it fails at 36170 and falls below 33396.
Critical resistance estimates: 37884, 39104, 40656, 42371, 43592, 45144
Critical support estimates: 36170, 34616, 33396, 31681, 29967, 28908
30 minutes price chart support and resistance forecast
H4 price chart support and resistance forecast
Author

Denis Joeli Fatiaki
Independent Analyst
Denis Joeli Fatiaki possesses over a decade of extensive experience as a multi-asset trader and Market Strategist.


