BNB price is set for decline if it closes below key support level
- BNB price trades near an ascending trendline; a firm close below would suggest a decline ahead.
- On-chain data paints a bearish picture as BNB’s long-to-short ratio is below one, and TVL is falling.
- A daily candlestick close above $583.1 would invalidate the bearish thesis.
Binance Coin(BNB) price trades slightly higher at around $548 on Thursday after declining 0.88% the previous day. It is currently trading near key support, and a sustained close beneath this level could indicate further declines. On-chain data further supports the bearish thesis as BNB’s long-to-short ratio is below one, and Total Value Locked (TVL) is falling, suggesting a potential price decline in the coming days.
BNB price shows weakness
Binance Coin price has retested and been rejected multiple times from its daily resistance level at $612.5. It again got rejected from this level on September 27 and declined 10.6% in the next five days. As of Thursday, it trades slightly higher in the day around $548, nearing its ascending trendline (drawn by connecting multiple low levels from early August).
In case BNB breaks below its ascending trendline and closes below the 200-day Exponential Moving Average (EMA) around $529.6, it could decline 10% to retest the September 6 low of $471.3.
The Moving Average Convergence Divergence (MACD) indicator further supports BNB’s fall, signaling a bearish crossover on Tuesday. The MACD line moved below the signal line to provide a sell signal. It also shows rising red histogram bars below the neutral line at zero, suggesting that BNB’s price could experience downward momentum.
Additionally, the daily chart’s Relative Strength Index (RSI) has fallen sharply to 44, below its neutral level of 50. A cross to levels below the neutral level generally indicates that bearish momentum is gaining traction.
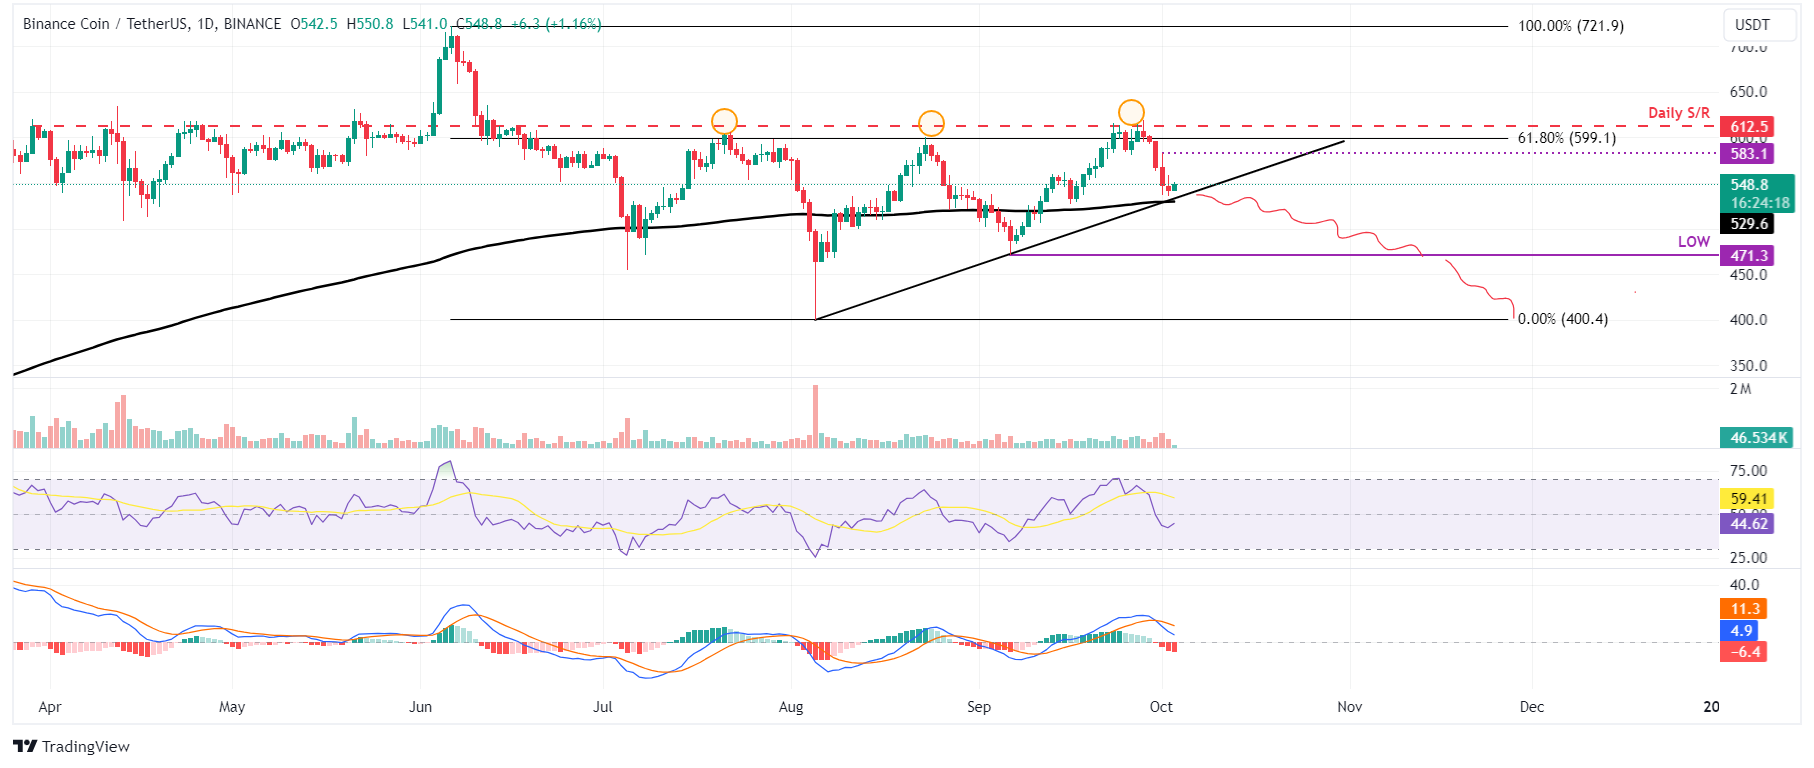
BNB/USDT daily chart
Crypto intelligence tracker Artemis data shows that BNB’s TVL decreased from $4.8 billion on Sunday to $4.5 billion on Thursday, constantly falling since the end of September.
This 6% decrease in TVL indicates decreasing activity and interest within the BNB ecosystem. It suggests fewer users deposit or utilize assets within BNB-based protocols, adding credence to the bearish outlook.
-638635378092541108.jpg)
BNB TVL chart
Moreover, Coinglass’s BNB’s long-to-short ratio is at 0.97, indicating a bearish outlook. The ratio below one reflects bearish sentiment in the market, as more traders are betting on the asset price to fall.
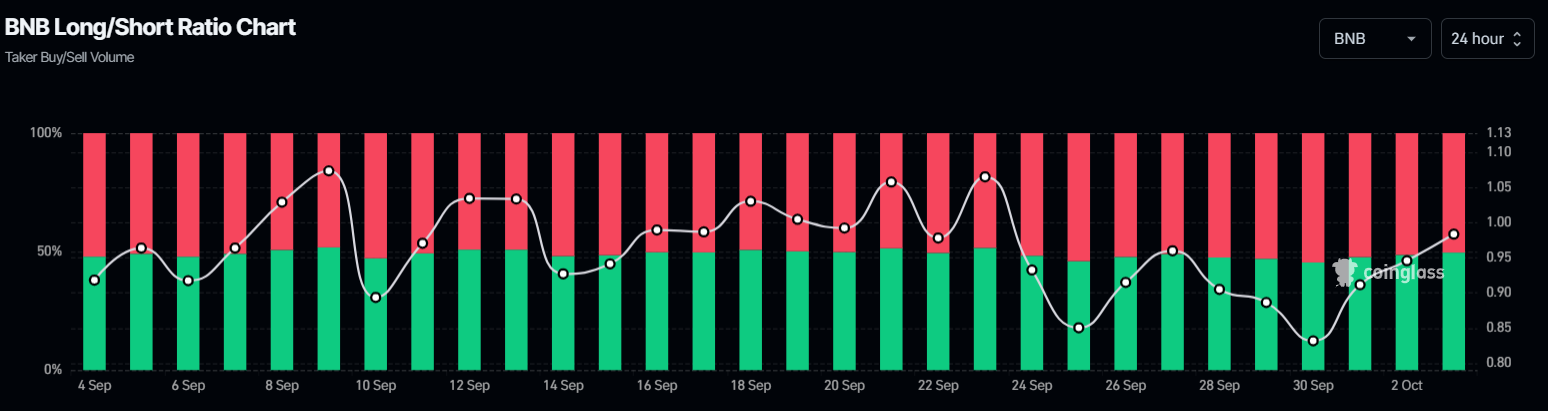
BNB long-to-short chart
However, the bearish thesis would be invalidated if BNB finds support around the ascending trendline and rises to close above Tuesday’s high of $583.1. This scenario would extend the rise to retest the daily resistance level at $612.5.
Author

Manish Chhetri
FXStreet
Manish Chhetri is a crypto specialist with over four years of experience in the cryptocurrency industry.


