Binance Elliott Wave technical analysis [Video]
Elliott Wave Analysis TradingLounge Daily Chart,
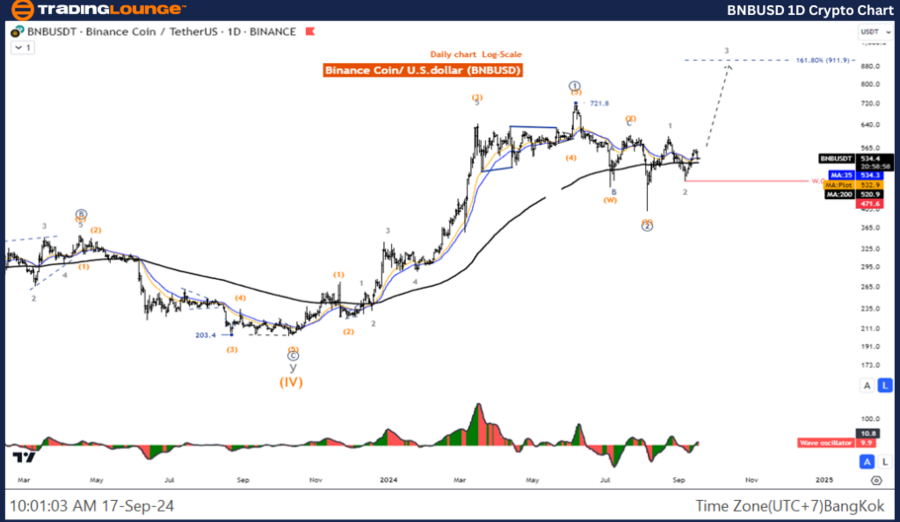
BNB/USD Elliott Wave technical analysis
Function: Counter Trend
Mode: Corrective
Structure: Double Corrective
Position: Wave ((Y))
Direction next higher degrees: Wave 2
Details: The decline of wave Y is likely to end and the price is re-entering the uptrend.
Binance / U.S. dollar (BNBUSD) Trading Strategy: It looks like the wave 2 correction is complete and the price is still likely to move up. Look for an opportunity to join the wave 2 uptrend.
Binance / U.S. dollar (BNBUSD)Technical Indicators: The price is above the MA200 indicating an Uptrend, The Wave Oscillator is a Bearish Momentum.
BNB/USD daily chart
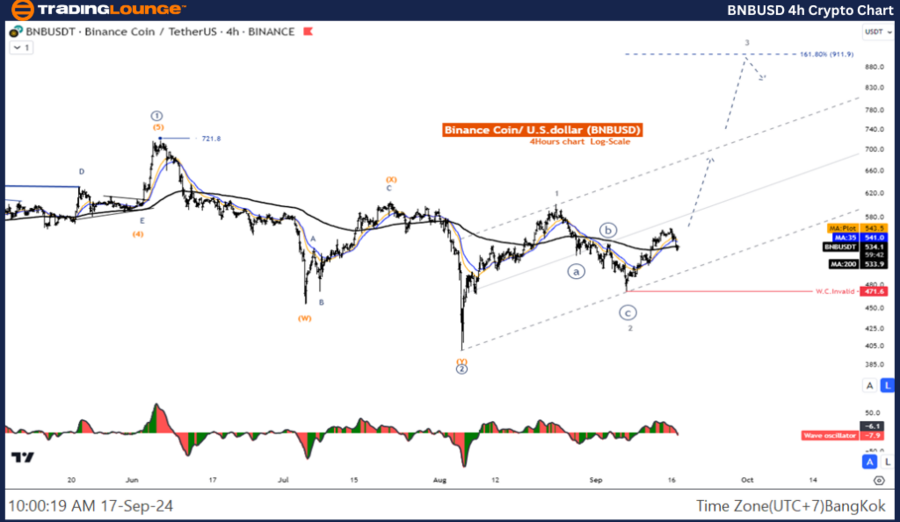
BNB/USD Elliott Wave technical analysis
Function: Counter Trend
Mode: Corrective
Structure: Zigzag
Position: Wave C
Direction next higher degrees: wave (2)
Details: Wave (2) is likely to end and the price is re-entering the uptrend.
Binance / U.S. dollar (BNBUSD)Trading Strategy: It looks like the wave 2 correction is complete and the price is still likely to move up. Look for an opportunity to join the wave 3 uptrend.
Binance / U.S. dollar (BNBUSD)Technical Indicators: The price is above the MA200 indicating an Uptrend, The Wave Oscillator is a Bearish Momentum.
BNB/USD four-hour chart
Binance Elliott Wave technical analysis [Video]
Author

Peter Mathers
TradingLounge
Peter Mathers started actively trading in 1982. He began his career at Hoei and Shoin, a Japanese futures trading company.


