BNB Price Forecast: Bullish technical pattern validated, eyes all-time high
- Binance Coin shows the breakout of a bullish pattern; the target projected is a new all-time high of $825.
- BNB’s open interest is rising, indicating an influx of capital, while its trading volume reached its highest since mid-August.
- A weekly candlestick close below $606.70 would invalidate the bullish thesis.

Binance Coin (BNB) trades slightly down on Tuesday after breaking above an ascending triangle formation on the weekly chart, following a 12.5% rally last week. The technical outlook suggests a bullish breakout pattern and continuation of the rally, with a target set for a new all-time high of $825.
On-chain data further support BNB’s rally. Its open interest is rising, indicating an influx of capital, while its trading volume reached its highest since mid-August.
Binance Coin is set for a new all-time high after ascending triangle breakout
Binance Coin price broke and closed above the ascending triangle formation on the weekly chart, rallying over 12.5% last week. This pattern was created by drawing two trendlines from mid-July, connecting swing points on the weekly chart between two higher lows and multiple equal highs.
This technical pattern breakout favors the bulls, and the target is generally obtained by measuring the distance between the first daily high and the first daily low to the breakout point. As of this week, it continues to rally, trading around $650.
If the breakout level is retested and support is found around the weekly level of $606.70, BNB could rally first to retest its all-time high (ATH) of $721.80, then extend the rally to form a new ATH of $825.65, the pattern’s technical target.
The Relative Strength Index (RSI) momentum indicator on the weekly chart reads at 60, above its neutral level of 50 and still far below overbought conditions, suggesting bullish momentum is gaining traction.
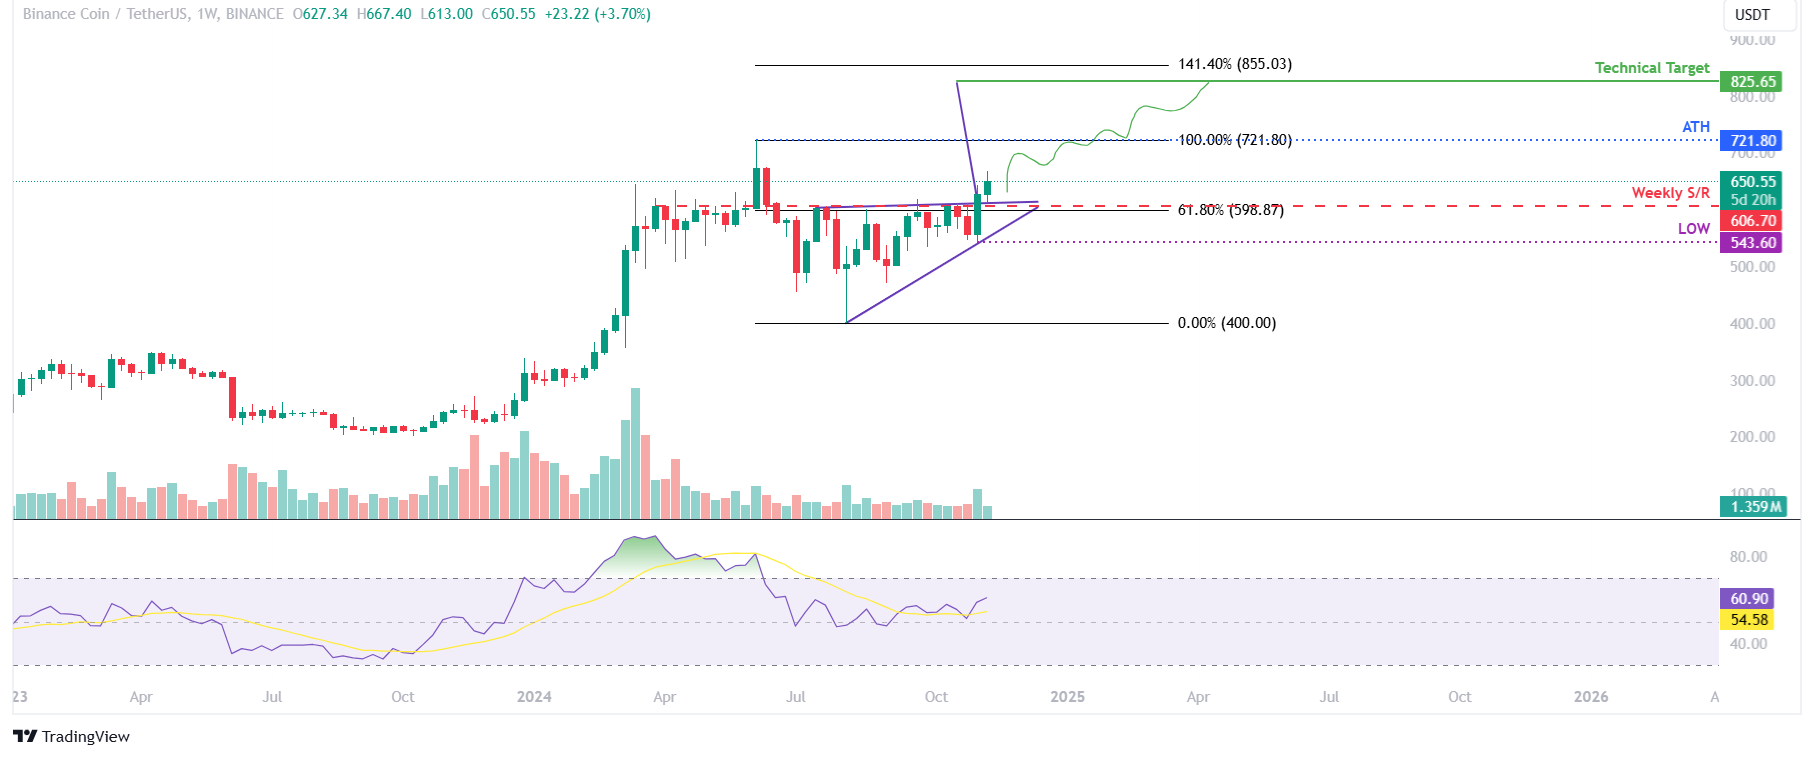
BNB/USDT weekly chart
Binance Coin’s recent surge in traders’ interest and liquidity projects a bullish outcome for its platform. Token terminal data shows that BNB Chain’s daily trading volume rose from $807.47 million on November 4 to $2.29 billion on Sunday, the highest since mid-August.
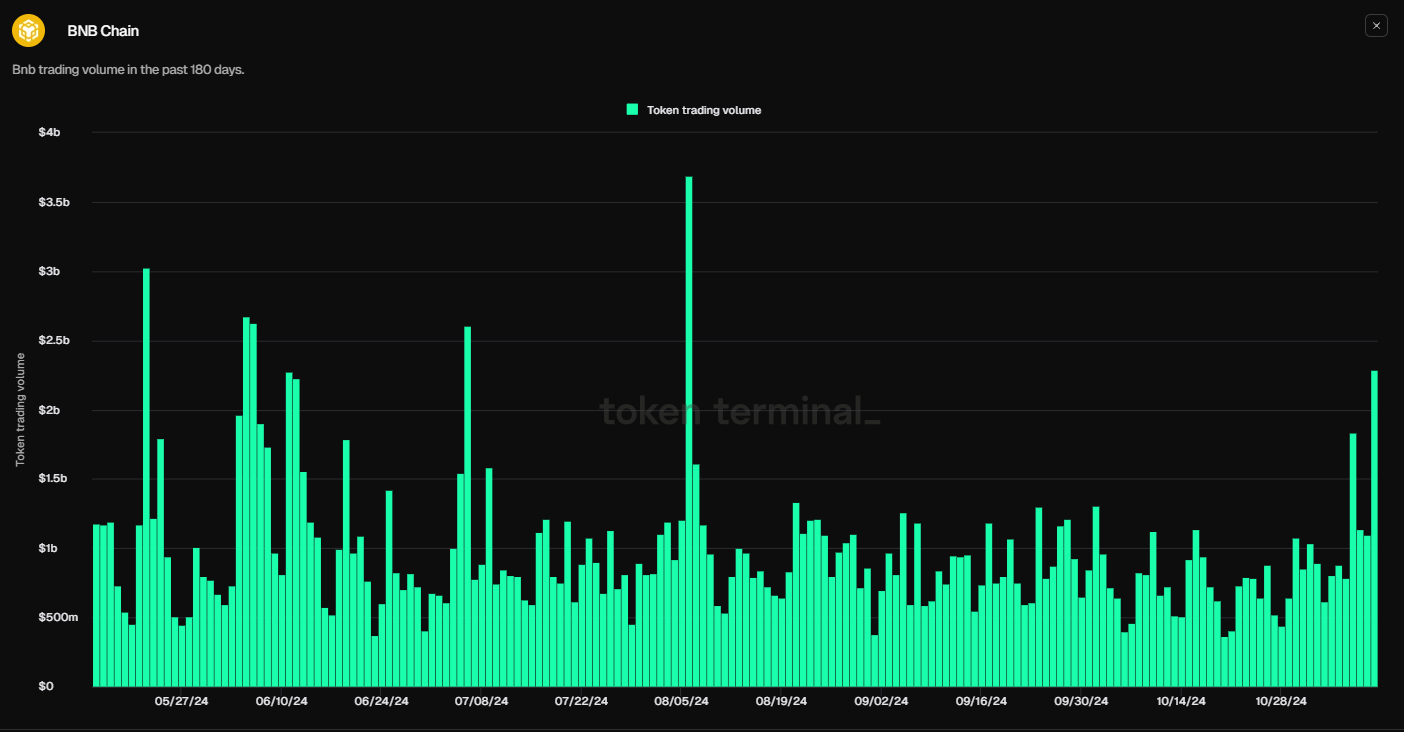
BNB chain daily trading volume chart. Source: Token terminal
Binance Coin’s Open Interest (OI) is rising, further supporting the bullish thesis. Coinglass’s data shows that the futures’ OI in BNB at exchanges rose from $575.96 million on Saturday to $797.46 million on Tuesday, the highest level since mid-June. Increasing OI represents new or additional money entering the market and new buying, which suggests a bullish trend.
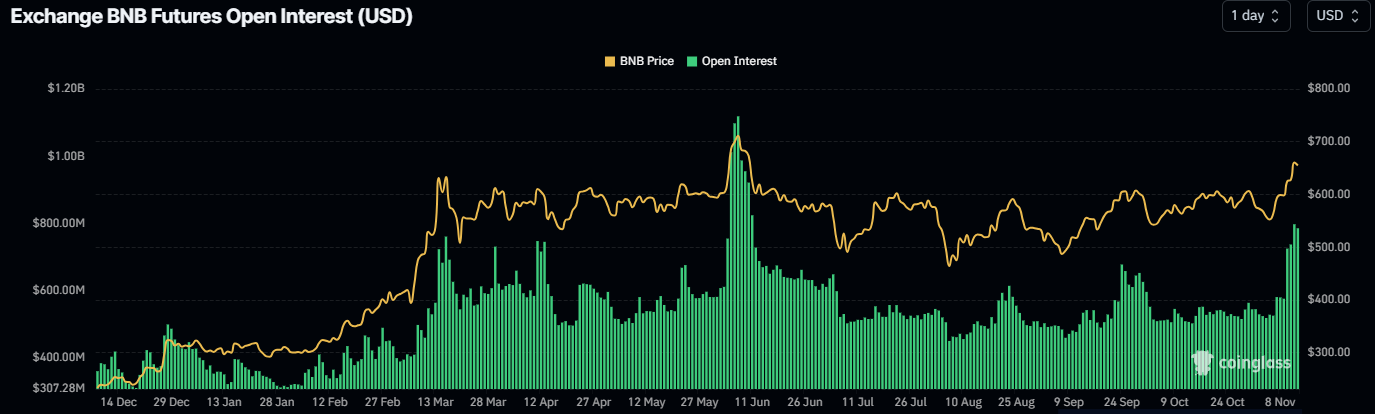
BNB Open Interest chart. Source: Coinglass
Even though on-chain metrics and technical analysis support the bullish outlook, if BNB makes a weekly candlestick close below $606.70, the bullish thesis would be invalidated. This development could see Binance Coin price decline by an additional 10.5% to retest its weekly low of $543.60.
Author

Manish Chhetri
FXStreet
Manish Chhetri is a crypto specialist with over four years of experience in the cryptocurrency industry.



