BNB Price Forecast: BNB bulls show signs of weakness
- Binance Coin was rejected at the resistance level of $612.5 and closed below the ascending trendline, indicating a potential downturn.
- Technical indicators back a downward trend as bearish MACD and RSI align.
- A daily candlestick close above $612.5 would invalidate the bearish thesis.
Binance Coin (BNB) is trading slightly above $578 on Friday after being rejected at a crucial level and closing below the ascending trendline. This breakdown indicates a shift in market structure from bullish to bearish. Technical indicators also support this bearish outlook, showing a bearish crossover that suggests a possible downtrend.
BNB is poised for a downturn following break below uptrend line
BNB faced repeated rejection at its daily resistance level of $612.5.As of Tuesday, it retested this level, declined over 5% until Thursday, and closed below the ascending trendline (drawn by connecting multiple low levels since early August). At the time of writing on Friday, it trades slightly above $578.7, retesting the trendline breakout level.
If the broken trendline around $580 is resistant, BNB's price could extend its decline by 8% to retest its October 3 low of $534.3. A successful close below this level may lead to a further 12% drop toward the next support level at $471.3.
The daily chart's Moving Average Convergence Divergence (MACD) indicator shows a bearish crossover on Wednesday, giving a sell signal. Additionally, red histogram bars are also rising and below the neutral line zero, suggesting the downward momentum is gaining traction.
The Relative Strength Index (RSI) indicator also aligns with the bearish outlook. It reads 47, below its neutral level of 50, indicating bearish momentum is rising.
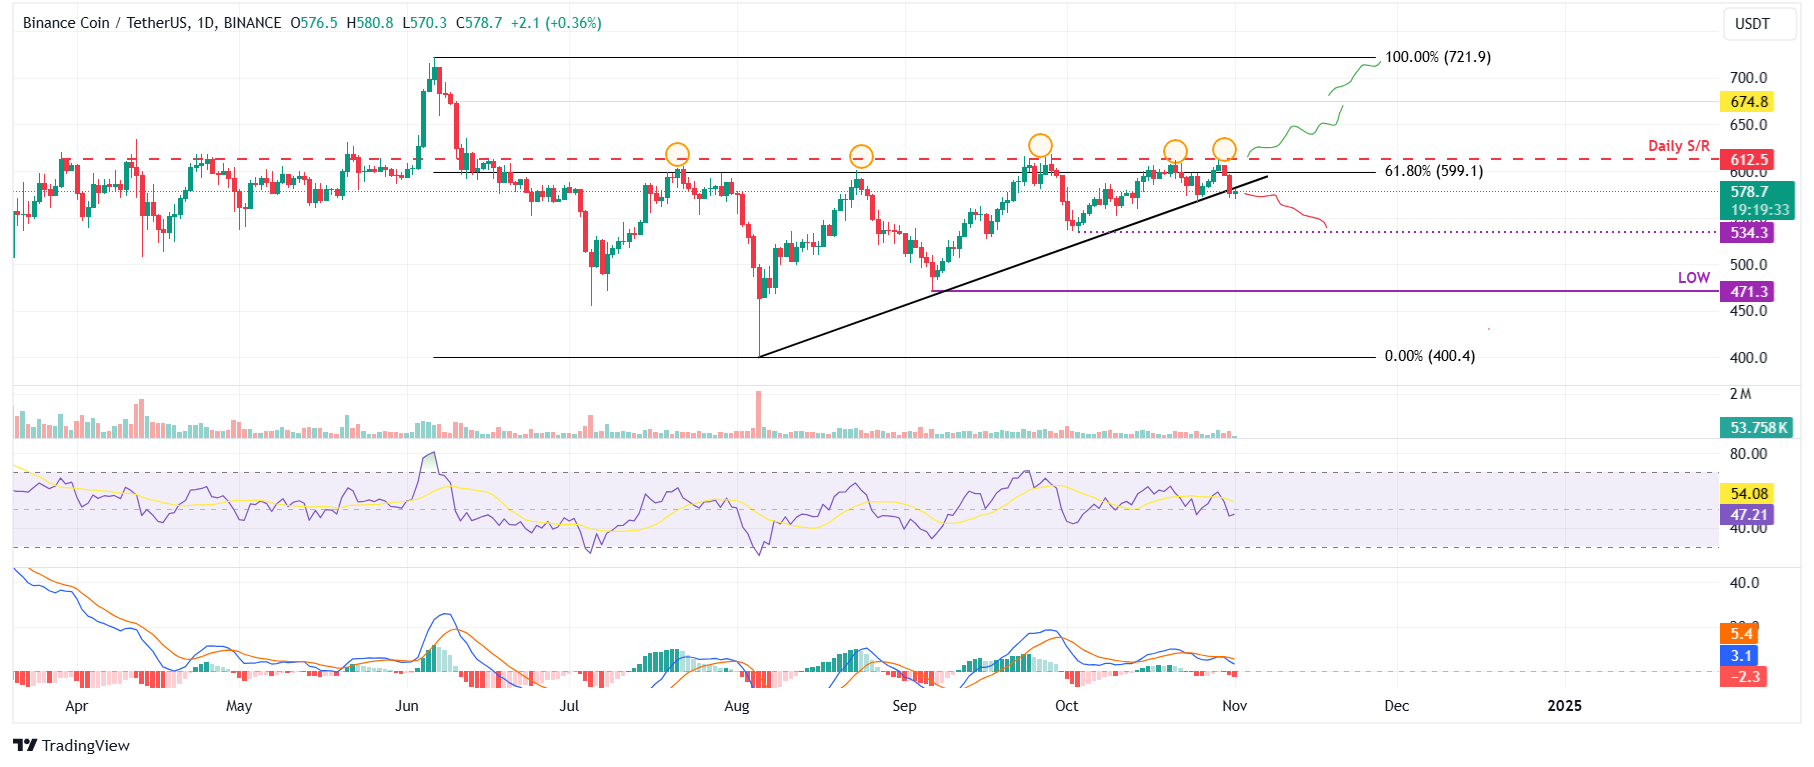
BNB/USDT daily chart
However, if the Binance Coin price rallies and closes above its daily resistance level of $612.5, it would create a higher high for the short-term uptrend. In such a scenario, the next target could be the June 10 high of $674.8.
Author

Manish Chhetri
FXStreet
Manish Chhetri is a crypto specialist with over four years of experience in the cryptocurrency industry.


